Learning Objectives
After reading this section, students should be able to
- understand what an environmental footprint is and its limitations
- conduct some basic footprinting calculations
- calculate and explain their own footprint
Basic Concepts of Footprinting
What is a common measure of the impact of an individual, institution, region or nation? This can be done by measuring the “footprint” of that entity. When discussing climate change and sustainability the concepts of carbon footprint and ecological footprint are often used. Understanding how these footprints are derived is important to the discourse as not all calculations are equal. These footprints can be calculated at the individual or household level, the institutional level (corporation, university, and agency), municipal level, sub-national, national or global. They are derived from the consumption of natural resources such as raw materials, fuel, water, and power expressed in quantities or economic value. The quantity consumed is translated into the footprint by using conversion factors generally based in scientific or economic values.
What is Your Carbon Footprint?
There are many personal calculators available on the internet. Here are a few to try:
This chapter will discuss three types of footprints – ecological, carbon and water – and the methodologies behind them. Although efforts have been made to standardize the calculations comparisons must be approached with caution. Comparing individual, institutional or national footprints that are calculated by the same method can be helpful in measuring change over time and understanding the factors that contribute to the differences in footprints.
Ecological Footprint
Concept
The Merriam-Webster Dictionary defines footprint as:
- an impression of the foot on a surface;
- the area on a surface covered by something
Similarly, the ecological footprint (EF) represents the area of land on earth that provides for resources consumed and that assimilates the waste produced by a given entity or region. It is a composite index (see Module Sustainability Metrics and Rating Systems) that represents the amount of biologically productive land and water area required to support the demands of the population in that entity or region The EF is beneficial because it provides a single value (equal to land area required) that reflects resource use patterns (Costanza, 2000). The use of EF in combination with a social and economic impact assessment can provide a measure of sustainability’s triple bottom line (Dawe, et al., 2004). It can help find some of the “hidden” environmental costs of consumption that are not captured by techniques such as cost-benefit analysis and environmental impact (Venetoulis, 2001). Using the ecological footprint, an assessment can be made of from where the largest impact comes (Flint, 2001).
Next, we will discuss the how an EF is calculated.
Methodology
The ecological footprint methodology was developed by William Rees and Mathis Wackernagel (1996), and consists of two methodologies:
- Compound calculation is typically used for calculations involving large regions and nations and is shown in Figure Compound Calculation Steps for Ecological Footprint Analysis. First, it involves a consumption analysis of over 60 biotic resources including meat, dairy produce, fruit, vegetables, pulses, grains, tobacco, coffee, and wood products. That consumption is then divided by biotic productivity (global average) for the type of land (arable, pasture, forest, or sea areas) and the result represents the area needed to sustain that activity. The second part of the calculation includes energy generated and energy embodied in traded goods. This is expressed in the area of forested land needed to sequester CO2 emissions from both types of energy. Finally, equivalence factors are used to weight the six ecological categories based on their productivity (arable, pasture, forest, sea, energy, built-up land). The results are reported as global hectares (gha) where each unit is equal to one hectare of biologically productive land based on the world’s average productivity. We derive sub-national footprints based on apportioning the total national footprint between sub-national populations. The advantage of this method is that it captures many indirect of effects of consumption so the overall footprint is more accurate.
- Component-based calculation resembles life-cycle analysis in that it examines individual products and services for their cradle-to-grave resource use and waste, and results in a factor for a certain unit or activity. The footprint is typically broken down into categories that include energy, transportation, water, materials and waste, built-up land, and food. This method is better for individuals or institutions since it accounts for specific consumption within that entity. However, it probably under-counts as not all activities and products could practically be measured or included. It also may double-count since there may be overlap between products and services.
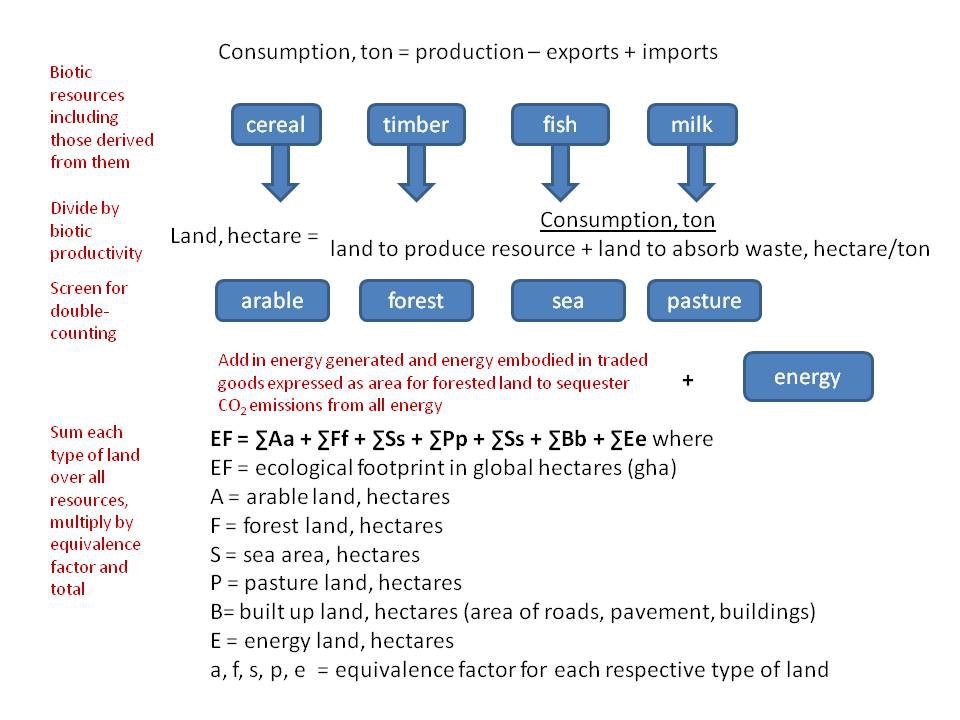
Compound Calculation Steps for Ecological Footprint Analysis Figure shows the compound calculation steps for ecological footprint analysis. Source: C. Klein-Banai.
What the Results Show
When looking at the sub-national level, it is useful to be able to examine different activities that contribute to the footprint such as energy, transportation, water, waste, and food. In both types of calculations, there is a representation of the energy ecological footprint. We utilize conversion factors that account for direct land use for mining the energy source and the land required to sequester any carbon emitted during combustion, construction, or maintenance of the power source. It should be noted that no actual component-based calculations have been done for nuclear power. The practice has been to consider it the same as coal so as to account for it in some way. A discussion of the merits of this method can be found in Wackernagel et al. (2005).
Transportation is another activity that can be examined at the sub-national level. The transportation footprint maybe considered part of the energy footprint, or separately, but is basically based on the energy consumption for transportation. It may also include some portion of the built-up land.
The hydroprint, or water-based footprint, measures the amount of water consumed in comparison to the amount of water in the land catchment system for the geographical area being footprinted. It can represent whether the entity is withdrawing more or less water than is naturally supplied to the area from rainfall.
The wasteprint, or waste-based footprint, is calculated using commonly used component-based factors that have been calculated and compiled in a number of publications and books. Food production requires energy to grow, process and transport, as well as land for growing and grazing. The factors are derived using the compound calculation for a certain geographical area. See Case Study: Comparing Greenhouse Gas Emissions, Ecological Footprint and Sustainability Rating of a University for an example of this kind of ecological footprint analysis. This kind of analysis can show us how a nation, region, organization, or individual uses the planets resources to support its operation or life style, as well as what activities are the primary contributors to the footprint. In the next section, we will look at some national footprints.
Ecological Footprint Comparisons
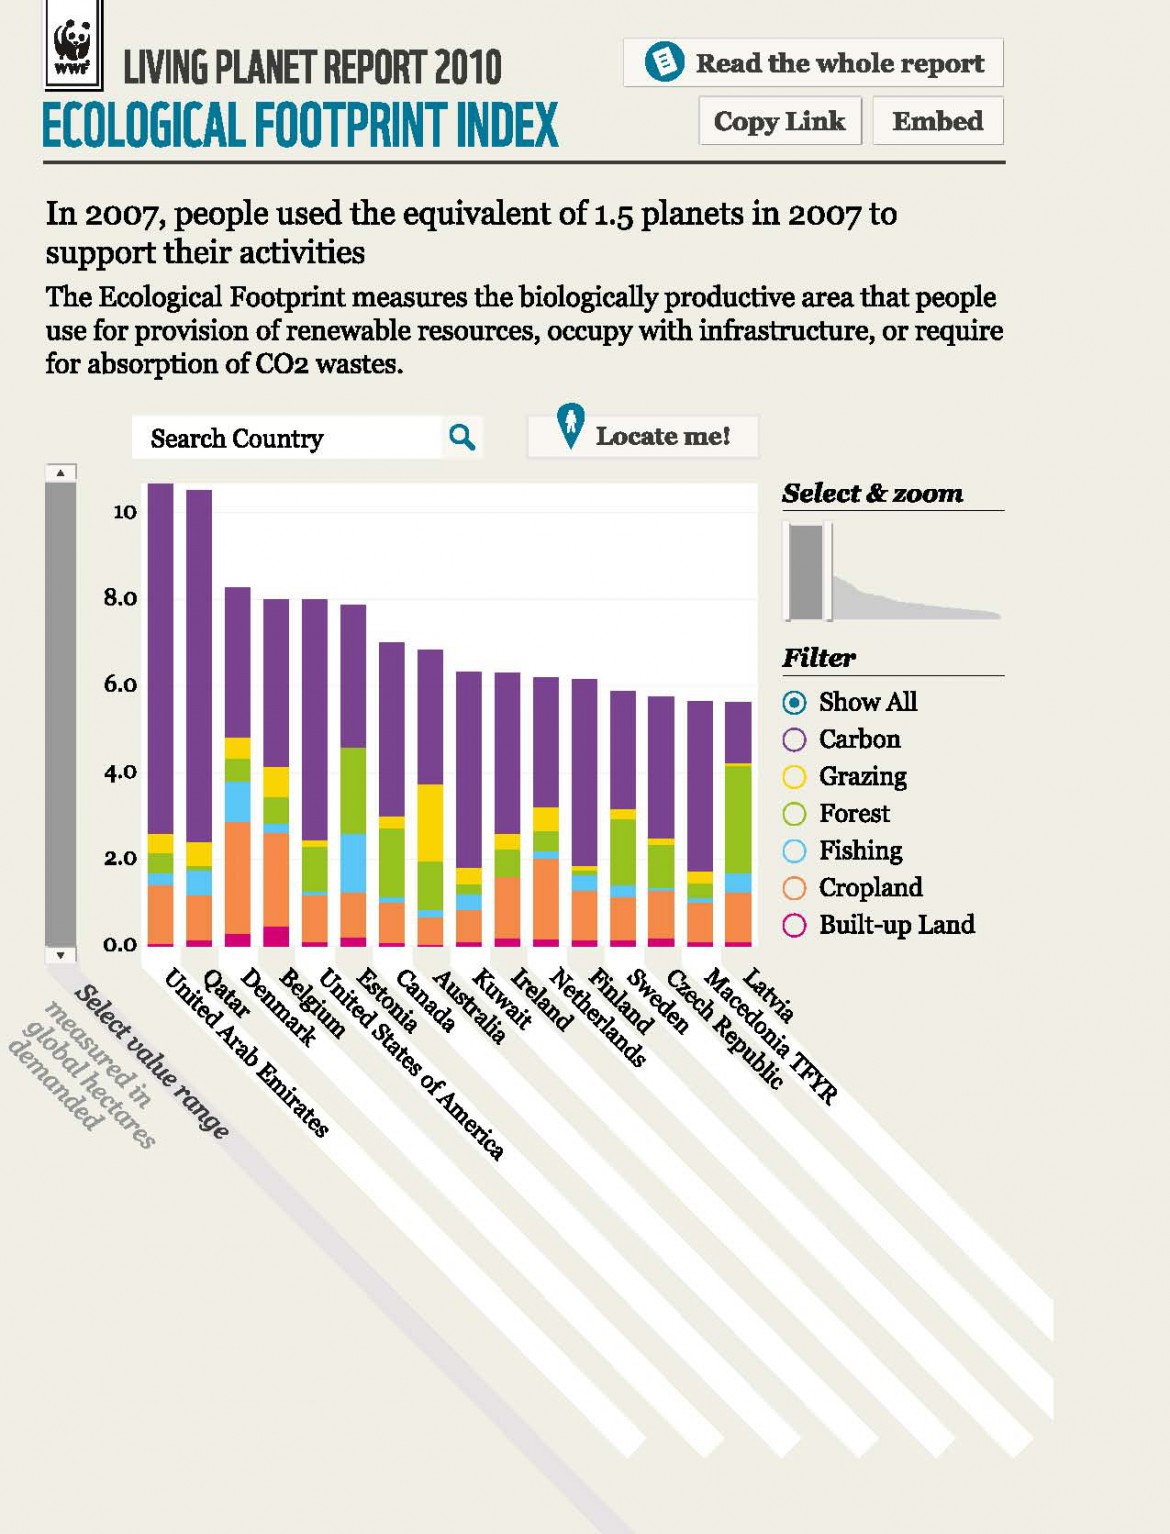
Ecological Footprints of Select Nations Graph shows the ecological footprints of select nations. The bars show average EF in global hectares per person for each nation. Each color on the bar represents the different types of land. Source: © 2010 WWF (panda.org). Some rights reserved. Living Planet Report, 2010 , figure under CC BY-SA 3.0 License
The Living Planet Report prepared by the World Wildlife Fund, the Institute of Zoology in London, and Wackernagel’s Global Footprint Network reports on the footprints of various nations. Figure Ecological Footprints of Select Nations displays the footprint of several nations as shown in the report. The bars show average EF in global hectares per person for each nation. Each color on the bar represents the different types of land. Here we see that the United Arab Emirates has the largest footprint of 10.2 gha per person, with the majority of its footprint due to carbon (same as energy land described above). Whereas Latvia has the lowest footprint displayed at 6.0 gha per person, with the majority of its footprint due to forestland.
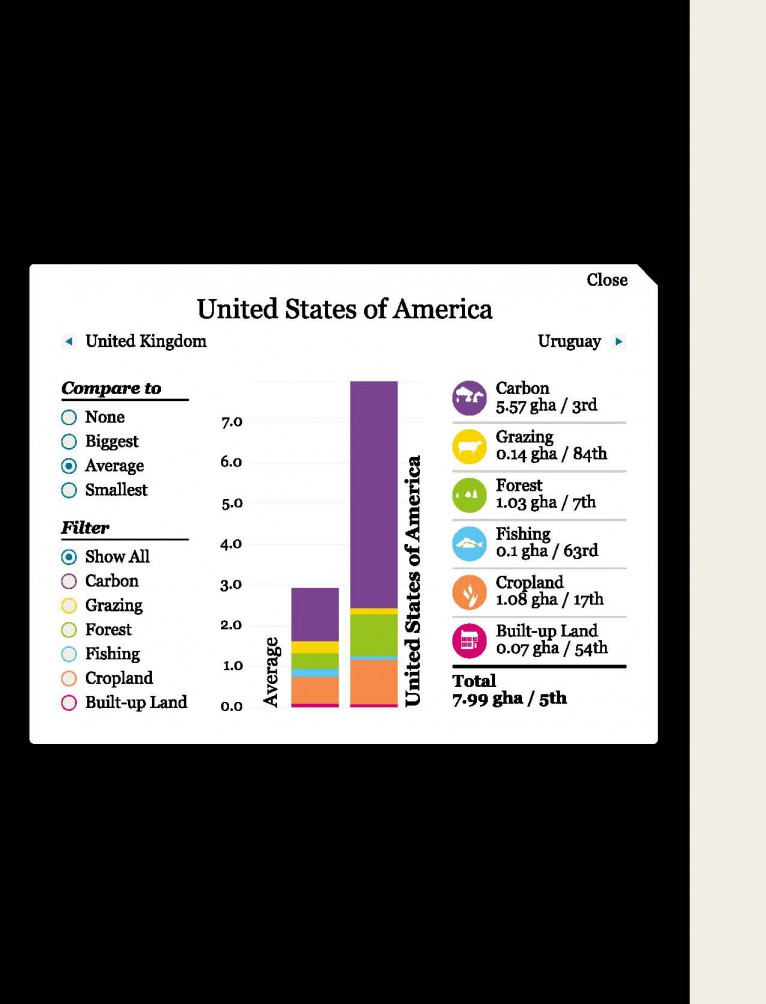
United States’ Ecological Footprint Figure shows the United States’ Ecological Footprint compared to the global average. Source: © 2010 WWF (panda.org). Some rights reserved. Living Planet Report, 2010, figure under CC BY-SA 3.0 License
Figure United States’ Ecological Footprint shows the national footprint in 2007 of the United States as 7.99 gha per person both with a bar display and with specific metrics on the right that show the exact footprint and the United States’ ranking among all nations in the report (e.g. carbon is 5.57 gha and ranks 3rd largest overall). The bar to the left expresses the world average. The United States’ footprint of 7.99 gha stands in contrast to the earth’s global biocapacity of 1.8 gha per person. Globally, the total population’s footprint was 18 billion gha, or 2.7 gha per person. However, the earth’s biocapacity was only 11.9 billion gha, or 1.8 gha per person. This represents an ecological demand of 50 percent more than the earth can manage. In other words, it would take 1.5 years for the Earth to regenerate the renewable resources that people used in 2007 and absorb CO2 waste. Thus, earth’s population used the equivalent of 1.5 planets in 2007 to support their lives.
Carbon Footprint
Since climate change (see Chapter Climate and Global Change) is one of the major focuses of the sustainability movement, measurement of greenhouse gases or carbon footprint is a key metric when addressing this problem. A greenhouse gas emissions (GHG) inventory is a type of carbon footprint. Such an inventory evaluates the emissions generated from the direct and indirect activities of the entity as expressed in carbon dioxide equivalents (see below). Since you cannot manage what you cannot measure, GHG reductions cannot occur without establishing baseline metrics. There is increasing demand for regulatory and voluntary reporting of GHG emissions such as Executive Order 13514, requiring federal agencies to reduce GHG emissions, the EPA’s Mandatory GHG Reporting Rule for industry, the Securities and Exchange Commission’s climate change disclosure guidance, American College and University Presidents’ Climate Commitment (ACUPCC) for universities, ICLEI for local governments, the California Climate Action Registry, and numerous corporate sustainability reporting initiatives.
Scoping the Inventory
The first step in measuring carbon footprints is conducting an inventory is to determine the scope of the inventory. The World Business Council for Sustainable Development (WBCSD) and the World Resource Institute (WRI) defined a set of accounting standards that form the Greenhouse Gas Protocol (GHG Protocol). This protocol is the most widely used international accounting tool to understand, quantify, and manage greenhouse gas emissions. Almost every GHG standard and program in the world uses this framework as well as hundreds of GHG inventories prepared by individual companies and institutions. In North America, the most widely used protocol was developed by The Climate Registry.
The GHG Protocol also offers developing countries an internationally accepted management tool to help their businesses to compete in the global marketplace and their governments to make informed decisions about climate change. In general, tools are either sector-specific (e.g. aluminum, cement, etc.) or cross-sector tools for application to many different sectors (e.g. stationary combustion or mobile combustion).
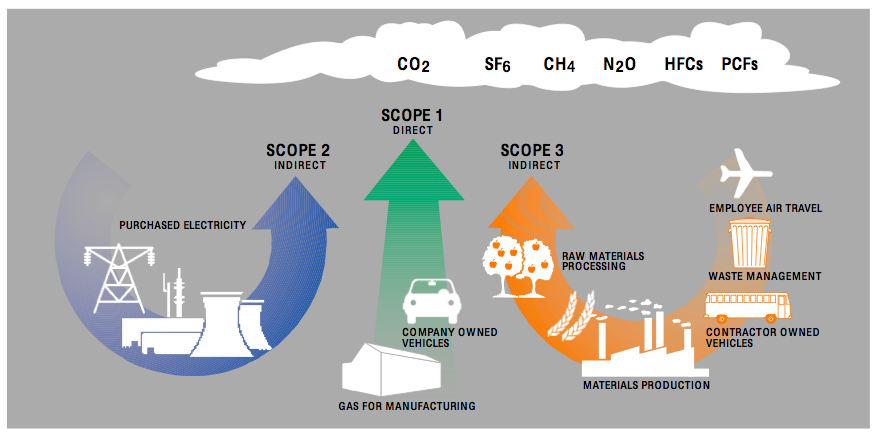
Scopes of a Greenhouse Gas Emissions Inventory Figure shows the three scopes of a greenhouse gas emissions inventory. Source: New Zealand Business Council for Sustainable Development, The challenges of greenhouse gas emissions: The “why” and “how” of accounting and reporting for GHG emissions (2002, August), figure 3, p. 10.
The WRI protocol addresses the scope by which reporting entities can set boundaries (see Figure Scopes of a Greenhouse Gas Emissions Inventory). These standards are based on the source of emissions in order to prevent counting emissions or credits twice. The three scopes are described below:
- Scope 1: Includes GHG emissions from direct sources owned or controlled by the institution – production of electricity, heat or steam, transportation or materials, products, waste, and fugitive emissions. Fugitive emissions are due to intentional or unintentional release of GHGs including leakage of refrigerants from air conditioning equipment and methane releases from farm animals.
- Scope 2: Includes GHG emissions from imports (purchases) of electricity, heat or steam – generally those associated with the generation that energy.
- Scope 3: Includes all other indirect sources of GHG emissions that may result from the activities of the institution but occur from sources owned or controlled by another company, such as business travel; outsourced activities and contracts; emissions from waste generated by the institution when the GHG emissions occur at a facility controlled by another company, e.g. methane emissions from landfilled waste; and the commuting habits of community members.
Depending on the purpose of the inventory the scope may vary. For instance, the EPA mandatory reporting requirements for large carbon dioxide sources require reporting of only Scope 1 emissions from stationary sources. However, many voluntary reporting systems require accounting for all three scopes, such as the ACUPCC reporting. Numerous calculator tools have been developed, some publicly available and some proprietary. For instance many universities use a tool called the Campus Carbon Calculator developed by Clean Air-Cool Planet, which is endorsed by the ACUPCC. Numerous northeastern universities collaborated to develop the Campus Carbon Calculator and the calculator has been used at more than 200 campuses in North America. It utilizes an electronic Microsoft Excel workbook that calculates estimated GHG emissions from the data collected.
Methodology
GHG emissions calculations are generally calculated for the time period of one year. Figure Steps for Preparing a GHG Emissions Report shows the steps for reporting GHG emissions. It is necessary to determine what the baseline year is for calculation. This is the year that is generally used to compare future increases or decreases in emissions, when setting a GHG reduction goal. The Kyoto Protocol proposes accounting for greenhouse gas emissions from a baseline year of 1990. Sometimes calculations may be made for the current year or back to the earliest year that data is available.
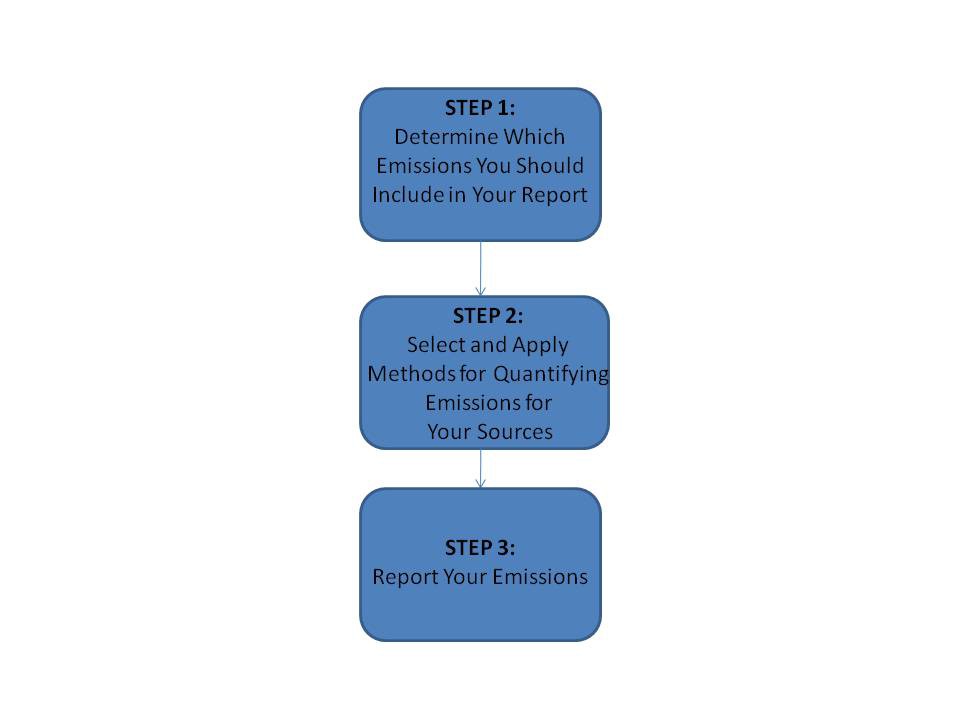
Steps for Preparing a GHG Emissions Report Figure shows the required steps to take when preparing a GHG emissions report. Source: C. Klein-Banai
Next, the institutional or geographic boundaries need to be defined. Also, the gases that are being reported should be defined. There are six greenhouse gases defined by the Kyoto Protocol. Some greenhouse gases, such as carbon dioxide, occur naturally and are emitted to the atmosphere through natural and anthropogenic processes. Other greenhouse gases (e.g. fluorinated gases) are created and emitted solely through human activities. The principal greenhouse gases that enter the atmosphere because of human activities are:
- Carbon Dioxide (CO2): Carbon dioxide is released to the atmosphere through the combustion of fossil fuels (oil, natural gas, and coal), solid waste, trees and wood products, and also as a result of non-combustion reactions (e.g. manufacture of cement). Carbon dioxide is sequestered when plants absorb it as part of the biological carbon cycle.
- Methane (CH4): Methane is emitted during the production and transport of coal, natural gas, and oil. Methane emissions also come from farm animals and other agricultural practices and the degradation of organic waste in municipal solid waste landfills.
- Nitrous Oxide (N2O): Nitrous oxide is emitted during agricultural and industrial activities, and combustion of fossil fuels and solid waste.
- Fluorinated Gases: Hydrofluorocarbons, perfluorocarbons, and sulfur hexafluoride are synthetic, powerful greenhouse gases that are emitted from a variety of industrial processes. Fluorinated gases are sometimes used as substitutes for ozone-depleting substances (i.e. Chlorofluorocarbons (CFCs), hydrochlorofluorocarbon (HCFCs), and halons). CFCs and HCFCs are gases comprised of chloride, fluoride, hydrogen, and carbon. Halons are elemental gases that include chlorine, bromine, and fluorine. These gases are typically emitted in smaller quantities, but because they are potent greenhouse gases, they are sometimes referred to as High Global Warming Potential gases (“High GWP gases”).
Each gas, based on its atmospheric chemistry, captures different amounts of reflected heat thus contributing differently to the greenhouse effect, which is known as its global warming potential. Carbon dioxide, the least capture efficient of these gases, acts as the reference gas with a global warming potential of 1. Table Global Warming Potentials shows the global warming potential for the various GHGs.
| Gas | GWP |
|---|---|
| CO2 | 1 |
| CH4 | 21 |
| N2O | 310 |
| HFC-23 | 11,700 |
| HFC-32 | 650 |
| HFC-125 | 2,800 |
| HFC-134a | 1,300 |
| HFC-143a | 3,800 |
| HFC-152a | 140 |
| HFC-227ea | 2,900 |
| HFC-236fa | 6,300 |
| HFC-4310mee | 1,300 |
| CF4 | 6,500 |
| C2F6 | 9,200 |
| C4F10 | 7,000 |
| C6F14 | 7,400 |
| SF6 | 23,900 |
GHG emissions cannot be easily measured since they come from both mobile and stationary sources. Therefore, emissions must be calculated. Emissions are usually calculated using the formula:
where A is the quantification of an activity in units that can be combined with emission factor of greenhouse gas g (Fg) to obtain the resulting emissions for that gas (Eg).
Examples of activity units include mmbtu (million British Thermal Units) of natural gas, gallons of heating oil, kilowatt hours of electricity, and miles traveled. Total GHG emissions can be expressed as the sum of the emissions for each gas multiplied by its global warming potential (GWP). GHG emissions are usually reported in metric tons of carbon dioxide equivalents (metric tons CO2-e):
Eg is usually estimated from the quantity of fuel burned using national and regional average emissions factors, such as those provided by the US Department of Energy’s Energy Information Administration.
Emission factors can be based on government documents and software from the U.S. Department of Transportation, the U.S. Environmental Protection Agency (EPA), and the U.S. Department of Energy, or from specific characteristics of the fuel used – such as higher heating value and carbon content. Scope 3 emissions that are based on waste, materials, and commuting are more complex to calculate. Various calculators use different inputs to do this and the procedures are less standardized. See Case Study: Comparing Greenhouse Gas Emissions, Ecological Footprint and Sustainability Rating of a University for an example of these kinds of calculations.
Greenhouse gas emissions inventories are based on standardized practice and include the steps of scoping, calculating, and reporting. They are not based on actual measurements of emissions, rather on calculations based on consumption of greenhouse gas generating materials such as fossil fuels for provision of energy and transportation or emissions from waste disposal. They can be conducted for buildings, institutions, cities, regions, and nations.
Carbon Footprint Comparisons
Comparison of carbon footprints reveal interesting differences between countries, particularly when compared to their economic activity. The World Bank tracks data on countries and regions throughout the world as part of their mission to “fight poverty…and to help people help themselves and their environment” (World Bank, 2011). Table Gross Domestic Product (GDP) and Emissions for Select Regions, 2007 shows the results for GHG emissions and gross domestic product for various regions of the world. It is interesting to note that the United States’ emissions per capita (19.34 mt e-CO2) are more than four times the world average. The United States’ economy makes up one fourth of the world GDP.
| Country Name | CO2 emissions (metric ton) | CO2 emissions (metric tons per capita) | GDP (current US$ millions) | GDP per capita (current US$) |
|---|---|---|---|---|
| East Asia & Pacific (all income levels) | 10,241,229 | 4.76 | $11,872,148 | $5,514 |
| Europe & Central Asia (all income levels) | 6,801,838 | 7.72 | $20,309,468 | $23,057 |
| Latin America & Caribbean (all income levels) | 1,622,809 | 2.87 | $3,872,324 | $6,840 |
| Latin America & Caribbean (developing only) | 1,538,059 | 2.75 | $3,700,320 | $6,610 |
| Least developed countries: UN classification | 185,889 | 0.23 | $442,336 | $553 |
| Middle East & North Africa (all income levels) | 1,992,795 | 5.49 | $1,924,470 | $5,304 |
| South Asia | 1,828,941 | 1.20 | $1,508,635 | $991 |
| Sub-Saharan Africa (all income levels) | 684,359 | 0.86 | $881,547 | $1,102 |
| United States | 5,832,194 | 19.34 | $14,061,800 | $46,627 |
| World | 30,649,360 | 4.63 | $55,853,288 | $8,436 |
Water Footprint
The water footprint of production is the volume of freshwater used by people to produce goods, measured over the full supply chain, as well as the water used in households and industry, specified geographically and temporally. This is slightly different from the hydroprint described above which simply compares the consumption of water by a geographic entity to the water that falls within its watershed. If you look at the hydrologic cycle (see module Water Cycle and Fresh Water Supply), water moves through the environment in various ways. The water footprint considers the source of the water as three components:
- Green water footprint: The volume of rainwater that evaporates during the production of goods; for agricultural products, this is the rainwater stored in soil that evaporates from crop fields.
- Blue water footprint: The volume of freshwater withdrawn from surface or groundwater sources that is used by people and not returned; in agricultural products this is mainly accounted for by evaporation of irrigation water from fields, if freshwater is being drawn.
- Grey water footprint: the volume of water required to dilute pollutants released in production processes to such an extent that the quality of the ambient water remains above agreed water quality standards.
The water footprint of an individual is based on the direct and indirect water use of a consumer. Direct water use is from consumption at home for drinking, washing, and watering. Indirect water use results from the freshwater that is used to produce goods and services purchased by the consumer. Similarly, the water footprint of a business or institution is calculated from the direct and indirect water consumption.
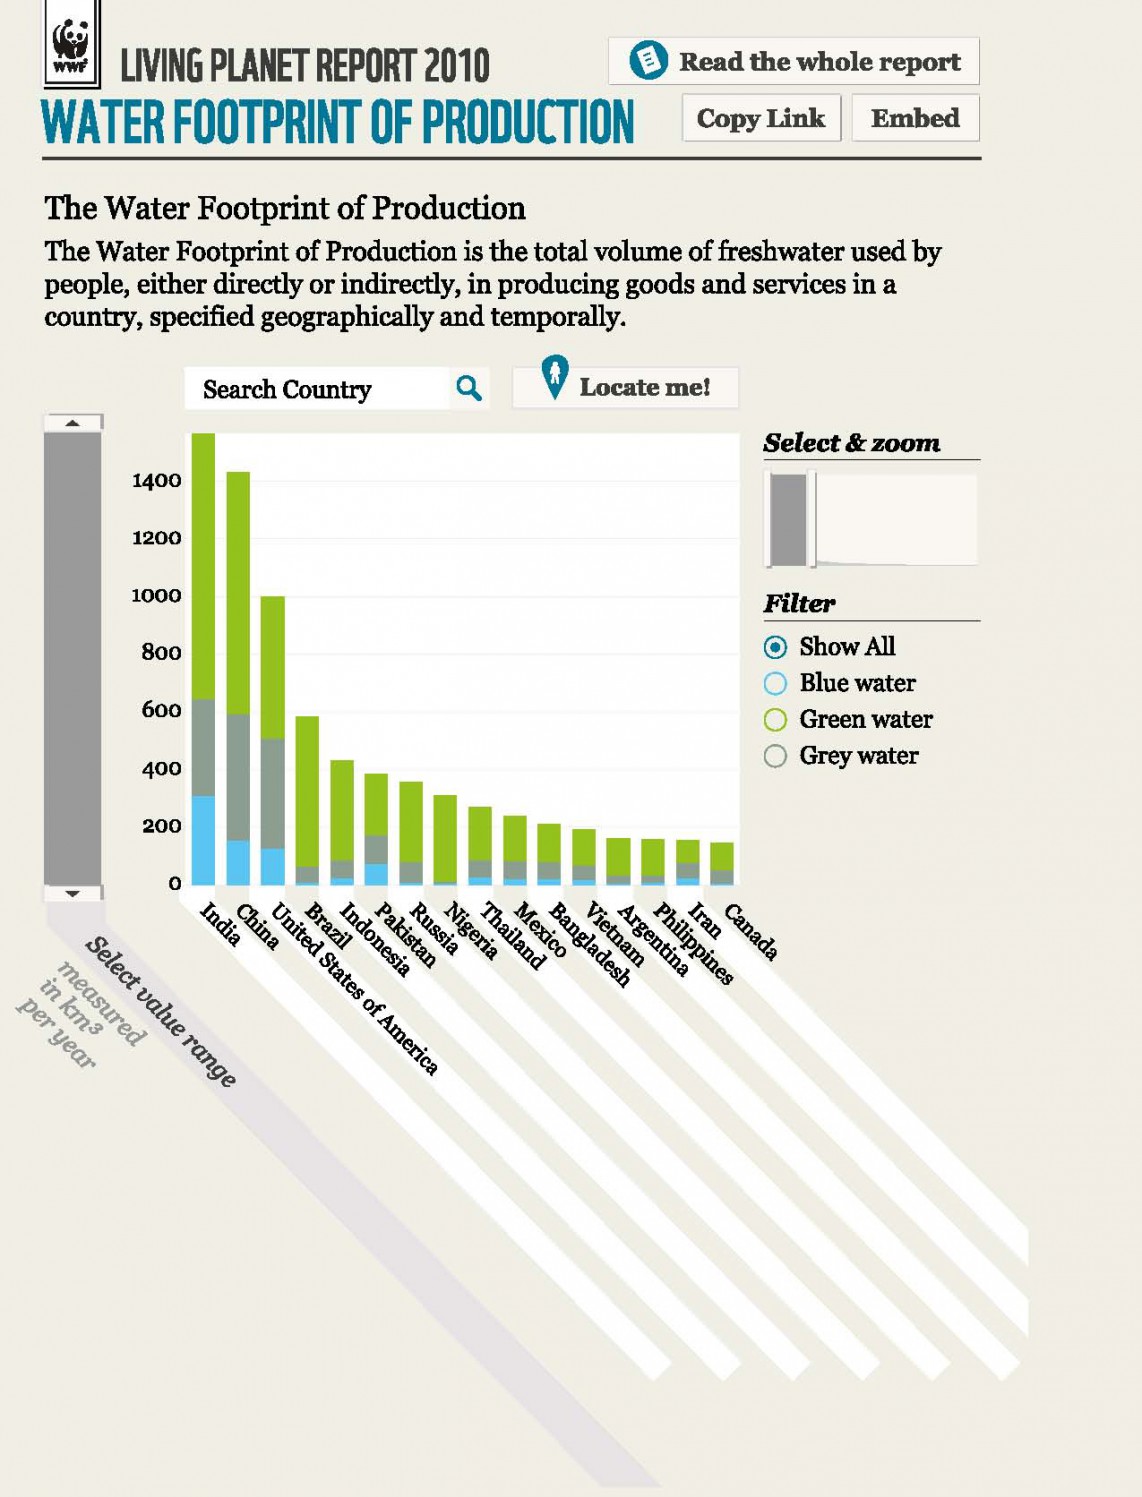
Water Footprint of Production of Select Countries Graph shows the water footprint of production of select countries. Source: © 2010 WWF (panda.org). Some rights reserved. Living Planet Report, 2010, figure under CC BY-SA 3.0 License
Figure Water Footprint of Production of Select Countries shows the water footprint of production for several countries as a whole. In this report, due to lack of data, one unit of return flow is assumed to pollute one unit of freshwater. Given the negligible volume of water that evaporates during domestic and industrial processes, as opposed to agriculture, only the grey water footprint for households and industry was included. This figure does not account for imports and exports it is only based on the country in which the activities occurred not where they were consumed.
In contrast, the water footprint of a nation accounts for all the freshwater used to produce the goods and services consumed by the inhabitants of the country. Traditionally, water demand (i.e. total water withdrawal for the various sectors of economy) is used to demonstrate water demand for production within a nation. The internal water footprint is the volume of water used from domestic water resources; the external water footprint is the volume of water used in other countries to produce goods and services imported and consumed by the inhabitants of the country. The average water footprint for the United States was calculated to be 2480m3/cap/yr, while China has an average footprint of 700m3/cap/yr. The global average water footprint is 1240m3/cap/yr. As for ecological footprints there are several major factors that determine the water footprint of a country including the volume of consumption (related to the gross national income); consumption pattern (e.g. high versus low meat consumption); climate (growth conditions); and agricultural practice (water use efficiency) (Hoekstra & Chapagain, 2007).
Using average water consumption for each stage of growth and processing of tea or coffee, the “virtual” water content of a cup can be calculated (Table Virtual Water Content of a Cup of Tea or Coffee). Much of the water used is from rainfall that might otherwise not be “utilized” to grow a crop and the revenue from the product contributes to the economy of that country. At the same time, the result is that many countries are “importing” water to support the products they consume.
| Drink | Preparation | Virtual water content (l/cup) |
|---|---|---|
| Coffee | Standard cup of coffee | 140 |
| Strong coffee | 200 | |
| Instant coffee | 80 | |
| Tea | Standard cup of tea | 34 |
| Weak tea | 17 |
To learn more about other countries’ water footprints, visit this interactive graph. To calculate your own water footprint, visit the Water Footprint Calculator.
The water footprint reveals that much more water is consumed to make a product than appears in using a simple calculation. It is not just the water content of the product but includes all water used in the process to make it and to manage the waste generated from that process.
Summary
Footprinting tools can be useful ways to present and compare environmental impact. They are useful because they can combine impacts from various activities into one measure. However, they have limitations. For instance, in a carbon footprint or greenhouse gas emissions inventory, many of the “conventional” environmental impacts such as hazardous waste, wastewater, water consumption, stormwater, and toxic emissions are not accounted for, nor are the impacts of resource consumption such as paper, food, and water generally measured. Perhaps most importantly, certain low-carbon fuel sources (e.g. nuclear power) that have other environmental impacts (e.g. nuclear waste) are neglected. Finally, the scope of the emissions inventory does not include upstream emissions from the manufacture or transport of energy or materials. This suggests that there is a need to go beyond just GHG emissions analyses when evaluating sustainability and include all forms of energy and their consequences.
The ecological footprint can be misleading when it is looked at in isolation, for instance with an urban area, the resources needed to support it will not be provided by the actual geographic area since food must be “imported” and carbon offset by natural growth that does not “fit” in a city. However, cities have many other efficiencies and advantages that are not recognized in an ecological footprint. When looked at on a national level it can represent the inequities that exist between countries.
It is interesting to contrast the water and ecological footprints, as well. The water footprint explicitly considers the actual location of the water use, whereas the ecological footprint does not consider the place of land use. Therefore it measures the volumes of water use at the various locations where the water is appropriated, while the ecological footprint is calculated based on a global average land requirement per consumption category. When the connection is made between place of consumption and locations of resource use, the consumer’s responsibility for the impacts of production at distant locations is made evident.
Exercises
Review Questions
Choose a calculator from the box and calculate your own footprint. How does it compare to the national or global average? What can you do to reduce your footprint?
Discuss what kind of inequities the various footprints represent between nations and the types of inequities.
How might the “food print” of a vegetarian differ from a carnivore?
References
Chambers, N., Simmons, C. & Wackernagel, M. (2000). Sharing Nature’s Interest: Ecological Footprints as an Indicator of Sustainability. London: Earthscan Publications Ltd.
Chapagain, A.K. & Hoekstra, A.Y. (2007). The water footprint of coffee and tea consumption in the Netherlands. Ecological Economics, 64, 109-118.
Constanza, R. (2000). The dynamics of the ecological footprint concept. Ecological Economics,32, 341-345.
Dawe, G.F.M., Vetter, A. & Martin. S. (2004). An overview of ecological footprinting and other tools and their application to the development of sustainability process. International Journal of Sustainability in Higher Education, 4, 340-371.
Flint, K. (2001). Institutional ecological footprint analysis: A case study of the University of Newcastle, Australia. International Journal of Sustainability in Higher Education, 2, 48-62.
Hoekstra,Y. & Chapagain, A. K. (2007). Water footprints of nations: Water use by people as a function of their consumption pattern. Water Resour Manage, 21, 35-48.
Klein-Banai, C. (2007). Greenhouse gas inventory for the University of Illinois at Chicago. UIC GHG Inventory,Retrieved November 21, 2009 from http://www.uic.edu/sustainability/reports/Appendix%206%20GHGEmissionsFY2005-2006.pdf
Rees, W.E. and Wackernagal, M. (1996). Urban ecological footprints and why cities cannot be sustainable – and why they are a key to sustainability. Environmental Impact Assessment Review, 16, 223-248.
Venetoulis, J. (2001). Assessing the ecological impact of a university: The ecological footprint for the University of Redlands. International Journal of Sustainability in Higher Education, 2, 180-196.
Wackernagel, M., Monfreda, C., Moran, D., Wermer, P., Goldfinger, S., Deumling, D., & Murray, M. (2005, May 25). National footprint and biocapacity accounts 2005: The underlying calculation method. Global Footprint Network. Retrieved March 2, 2010 from http://www.footprintnetwork.org/download.php?id=5.
World Bank (2011). About Us. Retrieved September 20, 2011 from http://go.worldbank.org/3QT2P1GNH0.
Glossary
- Anthropogenic
- Relating to or resulting from the influence that humans have on the natural world.
- Cradle-to-Grave
- From creation to disposal; throughout the life cycle.
- Ecological Footprint (EF)
- Represents the area of land on earth that provides for resources consumed and assimilates the waste produced by a given entity.
- Global Warming Potential (GWP)
- Each gas, based on its atmospheric chemistry, captures different amounts of reflected heat thus contributing differently to the greenhouse effect contributing to its GWP. Carbon dioxide, the least capture efficient of these gases, acts as the reference gas with a global warming potential of 1.
- Gross Domestic Product
- The sum of gross value added by all resident producers in the economy plus any product taxes and minus any subsidies not included in the value of the products. It is calculated without making deductions for depreciation of fabricated assets or for depletion and degradation of natural resources.
- Sequestered
- Removed from the atmosphere
- Triple Bottom Line
- Accounting for ecological and social performance in addition to financial performance
Candela Citations
- Sustainability: A Comprehensive Foundation. Authored by: Tom Theis and Jonathan Tomkin, Editors.. Provided by: OpenStax CNX. Located at: http://cnx.org/contents/1741effd-9cda-4b2b-a91e-003e6f587263@44.1. License: CC BY: Attribution. License Terms: Download for free at http://cnx.org/contents/1741effd-9cda-4b2b-a91e-003e6f587263@44.1