Learning Objectives
In this module, the following topics are covered: 1) the challenges are when measuring sustainability, 2) commonly used measures for sustainability, 3) the different types of measures and their value within a measuring system.
After reading this section, students should be able to
- understand what the challenges are when measuring sustainability
- be able to compare and contrast some commonly used measures for sustainability
- identify the different types of measures and their value within a measuring system
Introduction
The ideal method to measure sustainability would reflect the three-legged stool paradigm – environmental protection, social equity, and economic benefit. The metrics must make the connection between what the indicators measure and actual sustainability. A useful indicator will reflect changes over time that show whether a system is becoming more or less sustainable, and generally substitutes for something else or represents several measures (Sahely, 2005). The challenge of studying sustainability as an objective science is that the work is value-loaded and socially charged. If we are aware of the purpose of the analysis we can use a multidisciplinary approach to the problem definition and the research methodology (Lele and Norgaard, 1996).
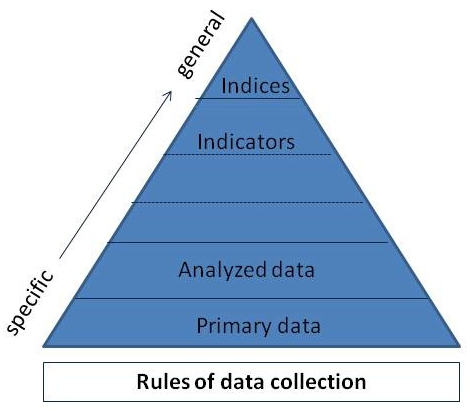
Information Pyramid The Information Pyramid shows ways of handling data when studying sustainability. Source: C. Klein-Banai.
In general, three approaches to sustainability measurement and reporting are commonly utilized: accounts that use quantitative data and convert them to a common unit such as money, area or energy; narrative assessments that include text, maps, graphics and tabular data; and indicator-based systems that may include the information that a narrative assessment has but they are organized around indicators or measurable parts of a system. Indicator-based systems are generally found to perform better and are easily measurable and comparable since they are more objective than narrative systems, or use only individual data points (Dalal-Clayton, 2002). Decision-makers and stakeholders need to participate in the development of indicators to be sure that their values and concerns are addressed. However, the system does need to be technically and scientifically based.
In the next few modules we will briefly discuss existing sustainability metrics that are generally based within certain disciplines such as ecology, economics, and physics, and how they may reflect other disciplines (see Table Common Sustainability Metrics). Most of these metrics are described in greater details in the following modules: The IPAT Equation, Biodiversity, Species Loss, and Ecosystem Function, Tragedy of the Commons, Environmental Valuation, Evaluating Projects and Policies, and Life Cycle Assessment.
| Method | Brief Description | Use | |
|---|---|---|---|
| Economic | Contingent valuation method (CVM) | Captures the preferences of the public regarding a good or service by measuring its willingness to pay | Good or service |
| Ecosystem services valuation | Valuation of services provided by nature such as cleaning of water by microorganisms | Good or service | |
| Cost Benefit Analysis (CBA) | Valuation of cost and benefits for each year of project/policy; calculation of a net present value (NPV) by aggregating and comparing costs and benefits over the whole life of project policy. | Project or policy | |
| Index of Sustainable Economic Welfare (ISEW) | Weights personal expenditures with an index of income inequality | Regional welfare | |
| Net national product (NNP) | Total income of the people in an economy less capital consumption or depreciation | Regional welfare | |
| Green NNP | Modification of above to account for loss of natural resource capital | Regional welfare | |
| Ecological | Resilience | Intensity of disturbance required to move system to a new regime | Ecosystem |
| Carrying capacity: Maximum sustainable yield (MSY) & IPAT | The maximum amount of resource extraction while not depleting the resource from one harvest to the next | Ecosystem | |
| Ecological footprint (EF) | Total area of productive land and water ecosystems needed to produce resources and assimilate waste of a given population | Individual, institutional, regional | |
| Physical | Emergy | The amount of solar energy that has been used directly or indirectly to make a good or service | Good or service |
| Exergy | The maximum work that can be extracted from a system when it moves towards thermodynamic equilibrium with a reference state | Policy, evaluation of energy systems |
Ecological Measures
Ecological measures of sustainability are used for natural systems. These measures include resilience and several constructs that are derivatives from carrying capacity. Resilience is the time needed for a system that provides desirable ecosystem goods and services to go back to a defined dynamic regime after disturbance. Resilience stresses the changing nature of ecosystems, rather than seeing them as static and providing a continuous and constant amount of natural resources. Carrying capacity estimates society’s total use of the resource stocks and flows provided by an ecosystem relative to the remaining resources needed by the ecosystem for stability and regeneration. Maximum sustainable yield (MSY) is an outgrowth of carrying capacity and the goal is to reach the maximum amount of resource extraction while not depleting the resource from one harvest to the next. Sustainability, in this context, can be understood as the point when the rate of resource extraction or harvest (MSY) equals the amount produced by the ecosystem. Previously discussed methods are types of measures of sustainability such as IPAT (see Module The IPAT Equation) which accounts for the effect of society on the amount of resources used when looking at carrying capacity. This type of measure looks at whether the impact of a human society is increasing or decreasing over time and can be used to compare impacts between societies of difference sizes or affluence levels.
Footprinting (see Module Footprinting: Carbon, Ecological and Water) is often used as a measure of sustainability that can be understood intuitively and is, therefore, useful when talking to the general public. The ecological footprint, which also represents the carrying capacity of the earth, is defined as “the total area of productive land and water ecosystems required to produce the resources that the population consumes and assimilate the wastes that the population produces, wherever on Earth that land and water may be located” (Rees and Wackernagel, 1996). This results in an evaluation of the demand and supply of natural capital of a given population (individual to planet) or a product/service.
Life-cycle assessment (LCA), a structured methodology that can be utilized to evaluate the environmental impacts of products, processes, projects, or services throughout their life cycles from cradle to grave (see Module Life Cycle Assessment) may be considered an ecological metric. A greenhouse gas emissions inventory is an example of this methodology (see Case Study: Greenhouse Gases and Climate Change).
Economic Measures
Economic measures place a monetary value on sustainability. Economists use the following measures of sustainability: ecosystem valuation, contingent valuation, and net national product, which are discussed in Chapter Environmental and Resource Economics. Standard economic methods can be used to evaluate environmental projects.
Indices that are used on a national and international level by organizations like the United Nations may be used to examine the economic and social welfare of a region. The Index of Sustainable Economic Welfare (ISEW) and other related frameworks that account for sustainable development have been conceived to provide an alternative to the Gross Domestic Product, which does not capture human welfare in its calculations. This system weights personal expenditures within a population with an index of income inequality and a set of factors are then added or subtracted to this monetary value. Monetary analysis of sustainability does not value the variety of sustainability issues especially those that cannot be measured as a product or service in today’s markets (Gasparatos, et al., 2008).
Physical Measures
Physical measures of sustainability use thermodynamic concepts in their calculations. Two physical approaches to measuring sustainability are exergy and emergy. These concepts are derived from the second law of thermodynamics which states that a closed system with constant mass and no energy inputs tends toward higher entropy or disorder. For instance, a piece of wood that is the product of many years of complex tree growth releases energy (light and heat in the flame) when burned, and becomes carbon ash, smoke, gases, and water vapor. This means that as properties within a system such as mass, energy, and chemical concentrations degrade (decompose) over time or burn, they also make available useful energy (exergy) for work. Ecosystems and human economies function under this second law, but they can use external energy (the sun) to maintain or increase energy supplies.
Emergy is the amount of energy of one kind (solar) that has been used directly or indirectly (through a transformation process) to make a service or a product of one type and it is expressed in units of (solar energy) emjoule. It can be thought of as a measure of all the entropy that has been produced over the whole process of creating a given product or service (Brown and Ulgiati, 2002). An example is the process of fossil fuel creation: solar energy was used by plants to grow and is stored in the complex molecular structures that held the plants together, when those plants died they decomposed and were buried over time under the changing earth, and the energy was concentrated into fossil fuels. Emergy, thus, allows us to account for all the environmental support needed by human and eco-systems or inputs.
Measures of energy inputs are transformed to emergy by use of a factor that represents the amount of environmental work needed to produce a product or provide a service. The emergy flows within a system include renewable resources (sunlight, rain, wind, agricultural production, timber harvest, etc.), non-renewable production (fossil fuels, metals, minerals, soils), and imports/exports. A sustainable system would have a net positive (or zero) emergy flow across its boundary (Mayer, et al., 2004). Emergy evaluations have been used, for instance, to quantitatively demonstrate that renewable energy plants had higher sustainability compared to thermal plants (Brown and Ugliati, 2002).
Exergy can be defined as the maximum work that can be extracted from a system as it moves to thermodynamic equilibrium with a reference state, as in the example of burned wood above. It has been used to study efficiency of chemical and thermal processes. This represents an entropy-free form of energy that is a measure of its usefulness, quality or potential to make change. Exergy accounting provides insights into the metabolism of a system and its effect on the environment using a common denominator. It can address energy utilization, be used for design and analysis of energy systems and to quantify waste and energy losses reflecting resource use. Exergy can account for an economic component, labor input, and impact of emissions on human health (Gasparatos, et al., 2008; Odum, 1996).
Comparison of Measures
So far we highlighted three categories for measures of sustainability – ecological, economic, and physical – and provided a few examples. Sustainability measures is an evolving field of study and the metrics are innumerable. Ecological measures include indicators that try to measure the sustainability of the ecosystem as a whole. Economic metrics use monetary measures and try to put a price on the environment and its services. They are valued based on currency, which is an anthropocentric value, meaning it is significant only to humans. They account only for human welfare to the extent that it depends on nature to survive. They do not account for the effect on an ecosystem as a whole, including plants and animals. Physical metrics are closely tied to thermodynamics and energy, and are generally expressed in units of energy.
Sustainability indicators are needed to improve our understanding of the nature of human demands on ecosystems and the extent to which these can be modified. Society uses resources for physical and social infrastructure and continually increases its needs due to population growth which is made possible by changing the way we grow and produce food, thus manipulating the food web. Some of these economic metrics are closely tied to social sustainability metrics as well and try to account for the social welfare of a population. Overall, while physical tools can capture certain environmental and economic issues, too, they do not address economic issues from the same perspective as conventional economic analysis. Moreover, they do not capture most social issues.
Economic markets do not usually directly value goods and services that ecological systems provide to human economies and societies. These ecosystem services include the uptake of carbon dioxide by plants and trees, purification of water by microorganisms, enrichment of soil through degradation of plant and animal materials, and rainfall that provides irrigation (see Constanza, et al., 1997). Also economists do not agree on the degree of substitutability between natural and man-made capital. This concept of substitutability means that natural capital such as 100 year old (“old forest”) trees used to build homes and furniture can be replaced by replanting fast-growing trees and provide the same value (Pearce, 1993). Technology also transforms the use of resources for instance by making them more readily available and more economic. An example of this is the use of “fracking” to produce natural gas from sources that were difficult to extract from a decade ago (see Module Environmental Challenges in Energy, Carbon Dioxide, Air and Water).
Sustainability Indicators and Composite Indices
There is no single indicator that can capture all aspects of sustainability within complex systems. When we speak of systems, we are referring to institutions, cities, regions, or nations. However, a group of indicators could be selected and analyzed under certain criteria that will better represent this type of system. An indicator represents a particular operational attribute of a system such as overall energy reduction, a GHG gas emissions inventory, what percentage of people commute by public transit, or percentage of people with a college degree. These are measured or observed at different times, locations, populations or combinations thereof. The Figure Information Pyramid represents the relationship between all these measures.
A group of indicators can then be evaluated using a composite indicator/index (CI) or rating. CIs stand at the top of an information pyramid where primary data lies at the base, followed by analyzed data, then indicators, and topped by indices. A composite indicator is formed by the compilation of various individual indicators into one index based on an underlying model. (Nardo, et al., 2005). An example is the Leadership in Energy and Environmental Design (LEED) which is a green building certification system developed by the U.S. Green Building Council (USGBC). It accounts for a large variety of building attributes that contribute to a building being considered “sustainable” such as building materials, location, landscape, energy usage, access to alternative transportation and so on. The final result is a numerical rating for the building that is then associated with a certain certification level (Certified, Silver, Gold, Platinum). This kind of system is most widely accepted and valued when a peer-review is conducted to determine what weights should be given to each attribute. When the USGBC decided to update its rating system because it did not accurately reflect the values of its members, it underwent review through its various committees.
Sometimes, when you have a lot of different measures that use different units you do not want to aggregate them together into one number. In this case, a multi-criteria assessment (MCA) can be used where constituent indicators are not aggregated into a single index. Multi-criteria analysis (similar name, different context) can be used as a tool to establish weights for several criteria, without requiring that all data be converted into the same units (Hermann, 2007). There are several multi-criteria evaluation methods that can be used for this. These methods may either be data-driven (bottom-up) when high-quality data is available or theory driven (top-down) when data is available for only one of the aspects. A broader review of this can be found in Gasparatos, et al. (2008).
Many industry sectors are developing frameworks or rating systems that provide ways to report and measure sustainability. Two examples are discussed here.
The Global Reporting Initiative (GRI) provides a system for organizations to publish their sustainability performance. Its purpose is to provide transparency and accountability for stakeholders and to be comparable among organizations. It is developed in an international, multi-stakeholder process and it is continuously improved. An organization determines which indicators from among those proposed it will report. However, no overall index or scores are reported. There is also usually a narrative portion to the report (Global Reporting Initiative). The indicators are broken down in environmental, economic and social performance indicators. Each area has core indicators with some additional indicators that may be used based on the organization’s choice.
The American Association of Higher Education (AASHE), is the lead organization in North America for sustainability in colleges and universities. One of their major projects has been the development of the Sustainability Tracking, Assessment and Rating System (STARS). This is a voluntary, self-reporting framework that is to be used to measure relative progress of universities and colleges as they work toward sustainability. STARS was developed using a collaborative process that involved input from many institutions. In 2008, a pilot study of 66 institutions was conducted to test the viability of the system and STARS version 1.0 was released in January 2010 with many schools reporting by January 2011. The credits are given in three categories of equal weight – education and research; operations; planning, administration and engagement. Each credit is given a weight based on the extent to which the credit contributes to improved environmental, financial and social impacts, and whether there are educational benefits associated with the achievement of this credit and the breadth of that impact. The result is a composite indicator, with transparent individual scoring. Schools participating in STARS will use an on-line reporting tool which makes the results publicly available. Depending on the total points achieved, a level of achievement is be assigned. The STARS rating will be good for three years but a school may choose to update annually. See Case Study: Comparing Greenhouse Gas Emissions, Ecological Footprint and Sustainability Rating of a University for an example of this reporting.
Examples of How an Index is Developed
Krajnc and Glavic (2005) developed a composite sustainable development index (ICSD) to track economic, environmental and social performance of company. Economic, environmental, and social sub-indices were calculated from normalized indicators within each sector. To calculate normalized indicators, the indicators for each sector, which typically have different units, were divided by the value in time (year) with its average value of all the time in the years measured. Alternatively, they can be normalized by using maximum and minimum values or target values. The Analytic Hierarchy Process was used to determine the weights of the environmental indicators. This is a multi-attribute decision model. The steps are:
- Setting the problem as a hierarchy with the top being the objective of the decision and lower levels consist of the criteria used at arriving at the decision.
- Pair-wise comparisons between two indicators.
- Use of a consistency ratio to check the consistency of each judgment.
- Step-by-step procedure of grouping various basic indicators into the sustainability sub-index.
- Sub-indices are combined into the composite sustainable development index.
The economic, environmental and social measures that were used in this model are as follows:
| Economic | Environmental | Social |
|---|---|---|
| Sales | Total energy consumption | No. of occupational accidents |
| Operating profit | Water consumption | No. of non-profit projects |
| Investment capital & expenditures | Production mass | No. of odor complains |
| Net earnings | Carbon dioxide, nitrous oxides, sulfur dioxide & dust emissions | No. of noise complaints |
| Research & development costs | Wastewater | No. of dust complaints |
| Number of employees | Waste for disposal | No. of neighbor complaints |
| Recycling | ||
| Hazardous waste |
An analytical tool, called COMPLIMENT, was developed to provide detailed information on the overall environmental impact of a business (Hermann, 2007). This tool integrates the concepts of life cycle assessment, multi-criteria analysis and environmental performance indicators. The combinations of environmental performance indicators used depend on the organization and reflect the relevant parts of the production train. The method includes setting system boundaries, data collection, calculation of potential environmental impacts and their normalization, aggregation of impacts using a multi-criteria analysis, the weights per impact category are multiplied by normalization potential impacts and the results can be added up for each perspective. The system boundary strives to be cradle-to-grave (from extraction of resources to disposal) although it may be a cradle-to-gate (from extraction of resources to completion of production) analysis.
Adoption of any single group of tools means that a certain perspective will be more highly represented in the sustainability assessment. “The need to address the multitude of environmental, social, economic issues, together with intergenerational and intragenerational equity concerns” (Gasparatos, et al., 2008, p. 306) produces problems that none of the disciplinary approaches can solve separately. Combining the outputs of biophysical and monetary tools will result in a more comprehensive sustainability perspective. The result is that the choice of metrics and tools must be made based on the context and characteristics that are desired by the analysts (Gasparatos, et al., 2008). Using a composite indicator or a set of individual indicators presented together can overcome the problem of using a single metric to measure sustainability.
Existing indicator-based sustainability assessments vary in the number of subsystems or assessment areas, the number of levels between subsystem and indicator, and whether they result in an index (compound indicator) of the state of the system and subsystems. These would include the ecosystem or environment, people or economy and society, and possibly institutions. The more subsystems assigned, the lower the weight given to the environmental portion. As more indicator systems are developed they become increasingly complex, yet there is a demand for a simple presentation that does not erase the complexity. A single indicator with true significance is not achievable, but by combining indicators into indices the results are more meaningful.
Representing Results for Multi-Criteria Assessment
Since measuring sustainability does not come down to a simple metric or few it is useful to use visualization techniques to display the results. One way to depict sustainability performance is to use a graphical view of progress, as shown in Figure Visualizing Results of Sustainability below for the GRI for universities. For each category a mapping of the scores was created. This appears as a hexagon indicating progress in each area for which points are achieved.
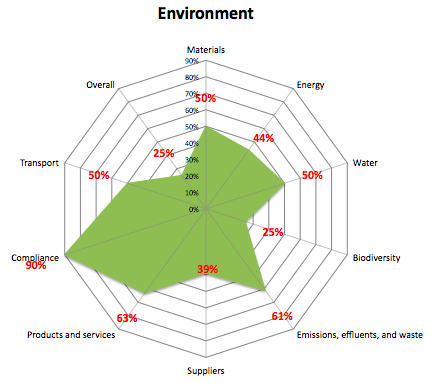
Visualizing Results of Sustainability Assessments Hypothetical graphical representation of the Environmental Dimension of the GRI for universities. The red numbers indicate the percentage of points achieved within each sub-category within the category of environment. Source: D. Fredman adapted from Lozano (2006).
Another example of visualizing sustainability is seen in a framework developed for universities to use (Troschinetz et al., 2007). Again, multidimensional sustainability indicators, each having an economic, environmental and social component are used. The categories are listed in Figure Sustainability Indicator Triangle. Each indicator was examined using a sustainability indicator triangle where each corner is delineated as economic, environmental or social and the indicators are placed within to the triangle to reflect how well each measures those aspects.
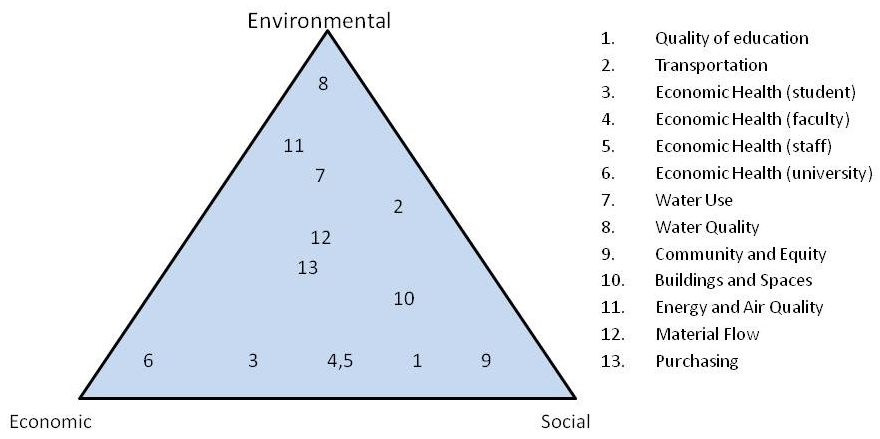
Source: C. Klein-Banai adapted from Troschinetz, et al. (2007).
Conclusion
Measuring sustainability is difficult because of the interdisciplinary nature and complexity of the issues that this concern represents. Methods have been developed out of the different disciplines that are based in the ecological, economic, physical and social sciences. When approaching a measure of sustainability it is important to understand what you will use the results of that measure for, what the major concerns you want to address are, and the limits of the system you choose. Often it is more meaningful to measure progress of the entity you are examining – is it more sustainable than it was before? It is difficult to compare similar entities (countries, companies, institutions, even products) due to the complexity and variability in the data. Using visualization to represent the data is a helpful way to show the state of sustainability rather than trying to express it in one number or in a table of numbers.
Review Questions
What is the difference between data and an index?
What is the major challenge in measuring sustainability?
Give three general categories of indicators that are used for measuring sustainability and provide one example of each.
Why is it important to have experts provide input to rating systems?
References
Brown, M.T. & Ulgiati, S. (2002). Emergy evaluations and environmental loading of electricity production systems. Journal of Cleaner Production, 10, 321-334. doi:10.1016/S0959-6526(01)00043-9
Constanza, R., d’Arge, R., de Groot, R., Farber, S., Grasso, R., Hannon, B., et al. (1997). The value of the world’s ecosystem services and natural capital. Nature, 387, 253–260.
Dalal-Clayton, B. & Bass, S. (2002). Sustainable development strategies: A resource book. London: Earthscan Publications Ltd.
Gasparatos, A., El-Haram, M., & Horner, M. (2008). A critical review of reductionist approaches for assessing the progress towards sustainability. Environmental Impact Assessment Review, 28, 286-311. doi:10.1016/j.eiar.2007.09.002
Hammond, A., Adriaanse, A., Rodenburg, E., Bryant, D., & Woodward, R. (1995). Environmental indicators: a systematic approach to measuring and reporting on environmental policy performance in the context of sustainable development. World Resources Institute. Retrieved March 7, 2011, from http://pdf.wri.org/environmentalindicators_bw.pdf.
Hermann, B.G., Kroeze, C., & Jawjit, W. (2007). Assessing environmental performance by combining life cycle assessment, multi-criteria analysis and environmental performance indicators. Journal of Cleaner Production, 15, 1878-1796. doi:10.1016/j.jclepro.2006.04.004
Krajnc, D. & Glavic, P. (2005). A model for integrated assessment of sustainable development. Resources Conservation & Recycling, 43, 189-203.
Lele, S. & Norgaad, R.B. (1996, April). Sustainability and the scientist’s burden. Conservation Biology, 10, 354-365. doi 10.1046/j.1523-1739.1996.10020354.x
Lozano, R. (2006). A tool for graphical assessment of sustainability in universities. Journal of Cleaner Production, 14, 963-972. doi: 10.1016/j.jclepro.2005.11.041
Mayer, A.L., Thurston, H.W. & Pawlowski, C.W. (2004). The multidisciplinary influence of common sustainability indices. Ecological Environment, 2, 419-426. doi:10.1890/1540-9295(2004)002[0419:TMIOCS]2.0.CO;2
Nardo, M., Saisana, M., Saltelli, A, Tarantola S., Hoffman, A. & Giovannini, E. (2005). Handbook on constructing composite indicators: Methodology and user guide (STD/DOC (2005)3). Paris: OECD Statistics Directorate. Retrieved February 26, 2011, from http://www.oecd.org/dataoecd/37/42/42495745.pdf
Odum, H.T. (1996). Environmental Accounting, Emergy, and Environmental Decision Making. New York: John Wiley & Sons, Inc.
Pearce, D.W. & G.D. Atkinson (1993). Capital theory and the measurement of sustainable development: an indicator of “weak” sustainability. Ecological economics, 8, 103-108.
Rees, W.E. & Wackernagel, M. (1996). Urban ecological footprints: why cities cannot be sustainable and why they are a key to sustainability. Enviromental Impact Assessment Review, 16, 223-248.
Reporting Framework Overview. (n.d.). Global Reporting Initiative. Retrieved August 21, 2011, from http://www.globalreporting.org/ReportingFramework/ReportingFrameworkOverview/
Sahely, H.R., Kennedy, C.A. & Adams, B.J. (2005). Developing sustainability criteria for urban infrastructure systems. Canadian Journal of Civil Engineering,32, 72-85. doi: 10.1139/l04-072
Troschinetz, A.M., Mihelcic, J.R., & Bradof, K.L. (2007). Developing Sustainability Indicators for a University Campus. International Journal of Engineering Education, 23, 231-241.
Glossary
- Carrying Capacity
- The maximum population that a given environment can sustain.
- Ecosystem
- All living organisms and non-living things that exist and interact in a certain area at the same time.
- Ecosystem Goods and Services
- An essential service an ecosystem provides that supports life and makes economic activity possible. For example, ecosystems clean air and water naturally, recycle nutrients and waste generated by human economic activity.
- Emergy
- The amount of energy of one kind (solar) that has been used directly or indirectly (through a transformation process) to make a service or a product as one type and it is expressed in units of (solar) emjoule.
- Emjoule
- The unit of emergy or emergy joule. Using emergy, sunlight, fuel, electricity, and human service can be put on a common basis by expressing each of them in the emjoules of solar energy that is required to produce them. If solar emergy is the baseline, then the results are solar emjoules (abbreviated seJ). Sometimes other baselines such as coal emjoules or electrical emjoules have been used but in most cases emergy data are given in solar emjoules.
- Entropy
- The degree of disorder in a substance, system or process as in the second law of thermodynamics that states that the make-up of energy tends to change from a more-ordered state to a less-ordered state, whereby increasing entropy.
- Exergy
- The maximum work that can be extracted from a system as it moves to thermodynamic equilibrium with a reference state.
- Indicator
- A variable equal to an operational representation of an attribute of a system.
- Indicator-Based Systems
- Systems that use quantitative measures of economic progress, social welfare, or environmental activity that can be interpreted to explain the state of that system. Examples of these are gross domestic product, greenhouse gas emissions, and the unemployment rate.
- Maximum Sustainable Yield (MSY)
- An outgrowth of carrying capacity and the goal is to reach the maximum amount of resource extraction while not depleting the resource from one harvest to the next.
- Narrative Assessments
- Descriptive documentation of a program, plan, or project.
- Quantitative Data
- Information that can be quantified numerically such as tons of waste, gallons of gasoline, and gallons of wastewater.
- Resilience
- The ability of an ecological community to change in response to disturbance and the degree or time needed for that system that provides desirable to go back to its original state.
Candela Citations
- Sustainability: A Comprehensive Foundation. Authored by: Tom Theis and Jonathan Tomkin, Editors.. Provided by: OpenStax CNX. Located at: http://cnx.org/contents/1741effd-9cda-4b2b-a91e-003e6f587263@44.1. License: CC BY: Attribution. License Terms: Download for free at http://cnx.org/contents/1741effd-9cda-4b2b-a91e-003e6f587263@44.1