Conduct a hypothesis test or construct a confidence interval to investigate a difference between two population means. Interpret results in context.
Learning Objectives
- Under appropriate conditions, conduct a hypothesis test about a difference between two population means. State a conclusion in context.
Introduction
In this section, we learn to make inferences about a difference between two population means. Our work here parallels our work in inference about a difference between two population proportions. Recall the following slogan from the previous module, Inference for Two Proportions.
It’s Not about the Values – It’s about How They Are Related!
So just as in that module, the value of the population means is not the focus of inference. Instead, we want to develop tools for determining the relationship between two unknown population means. We select independent random samples from two different populations and find the difference in the sample means. We use the sample difference either to conduct a hypothesis test about the difference in population means or to estimate the difference using a confidence interval.
Example
Beer and Reaction Time
Suppose researchers study the effect of low levels of alcohol on drivers’ reaction time. Consider the following two study designs.
Design 1:
Researchers select a random sample of 19 drivers and assign them randomly to one of two treatments. The 9 drivers in the treatment group each drink two beers. The 10 drivers assigned to the control group do not drink beer. The response variable is reaction time (measured in seconds). The reaction time is the time it takes the driver to hit the brakes in a driving simulator when an obstacle appears in the road. The random assignment guarantees, at least in theory, that the two groups are independent.
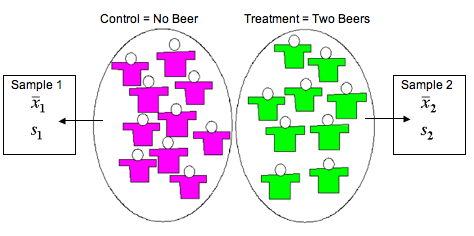
In this design, we calculate a mean and standard deviation in response time for each group. We use the difference in the sample means to either test a hypothesis about, or calculate a confidence interval for, a difference in two population means or two treatments.
Design 2:
Researchers randomly select 8 drivers. The experiment is a matched-pairs design with two measurements taken for each driver. The researchers measure the reaction times in the driving simulator before and then after the consumption of two beers.

In this design, we first calculate the differences in the two measurements for each driver. Then we calculate the mean and standard deviation of this one list of numbers. We use the single sample mean to either test a hypothesis about, or calculate a confidence interval for, a single population or a treatment effect. This is one of the types of inference we did in the previous section, “Hypothesis Test for a Population Mean.”
Learn By Doing
Learn By Doing
Identify the situations that involve inference about a difference between two population means by choosing “valid” or “invalid.”
Candela Citations
- Concepts in Statistics. Provided by: Open Learning Initiative. Located at: http://oli.cmu.edu. License: CC BY: Attribution