Learning Objectives
- Explain the meaning of assigning the independent variable of a function a value
- Determine function values given a domain value
- Explain the meaning of assigning a function a value
- Determine a domain value given a function value
Assigning the Independent Variable a Value
Determining function values
The algebraic form of a function defines the independent and dependent variables of the function. For example, the function [latex]f(x)=2x+1[/latex], designates [latex]x[/latex] as the the independent variable. We know this because [latex]x[/latex] is the variable in parentheses next to the function name, [latex]f[/latex]. The dependent variable is the function value, and is dependent on the value of the independent variable. The values of the independent variable determine the values of the function (the dependent variable) through the rule described in the algebraic form of the function.
For example, the function[latex]f(x)=2x+1[/latex] has a function value of 1 when the independent variable [latex]x[/latex] is 0. To determine this, we substitute [latex]x=0[/latex] in the function:
[latex]f(x)=2x+1\\f(0) = 2(0) + 1 =1[/latex]
The notation [latex]f(0)[/latex] means the function value (or the value of the dependent variable) given the value of the independent variable [latex]x[/latex] is 0. The function value is 1, after the independent variable in the rule is replaced with 0. Therefore, we may write [latex]f(0)=1[/latex]. Similarly, the function value is 11 after the independent variable in the rule is replaced with 5.
[latex]f(x)=2x+1\\f(5) = 2(5) + 1 = 10 + 1 = 11[/latex]
On the coordinate plane, a function is a graph. The graph is composed of those points [latex](x,y)[/latex] where [latex]x[/latex] is the independent variable and [latex]y=f(x)[/latex] is the dependent variable. Therefore, when assigning the independent variable a value (e.g., [latex]x=5[/latex]), it refers to the point on the graph where the [latex]x[/latex]-coordinate is 5. According to the graph in figure 1, we can determine that the [latex]y[/latex]-coordinate is 11 when the [latex]x[/latex]-coordinate is 5 because the point (5, 11) lies on the graph of the function. The point (5, 11) is the point where the vertical line [latex]x=5[/latex] intersects the graph [latex]y=f(x)[/latex].
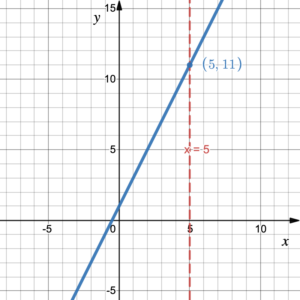
Figure 1.
Example 1
Determine the function values for [latex]g(x)=x^2+3x-2[/latex]:
- [latex]g(0)[/latex]
- [latex]g(2)[/latex]
- [latex]g(–1)[/latex]
Solution
Replace [latex]x[/latex] in the function with each of the values 0, 2, and –1. Inserting the [latex]x[/latex]-values inside parentheses helps keep the order of operations in our minds.
| g(0) | g(2) | g(-1) |
|---|---|---|
| 1.
[latex]g(x)=x^2+3x-2\\g(0)=(0)^2+3(0)-2=-2[/latex] |
2.
[latex]g(x)=x^2+3x-2\\g(2)=(2)^2+3(2)-2\\g(2)=4+6-2=8[/latex] |
3.
[latex]g(x)=x^2+3x-2\\g(-1)=(-1)^2+3(-1)-2\\g(-1)=1-3-2=-4[/latex] |
Try It 1
Determine the function values for [latex]f(x)=\frac{2x}{x-3}[/latex]:
- [latex]f(0)[/latex]
- [latex]f(-2)[/latex]
- [latex]f(3)[/latex]
Why do you think there is no function value at [latex]x=3[/latex] for the function [latex]f(x)=\frac{2x}{x-3}[/latex]? If we look at the graph, we may gain a better understanding. Figure 2 shows the graph of the rational function [latex]f(x)=\frac{2x}{x-3}[/latex]. The reason that [latex]f(3)[/latex] is undefined is because there is a vertical asymptote at [latex]x=3[/latex]. A graph can never cross a vertical asymptote, so there is no function value at [latex]x=3[/latex].
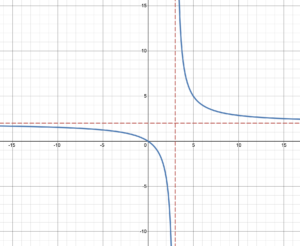
Figure 2. [latex]f(x)=\frac{2x}{x-3}[/latex]
Example 2
Use the graph to determine the function values [latex]f(x)[/latex] at the given [latex]x[/latex]-values.
- [latex]x=0[/latex]
- [latex]x=1[/latex]
- [latex]x=-1[/latex]
Solution
- The line [latex]x=0[/latex] intersects the graph at the point (0, –3) so [latex]f(0) = -3[/latex].
- The line [latex]x=1[/latex] intersects the graph at the point (1, –2) so [latex]f(1) = -2[/latex].
- The line [latex]x=-1[/latex] intersects the graph at the point (-1, –4.5) so [latex]f(-1) = -3.5[/latex].
Try It 2
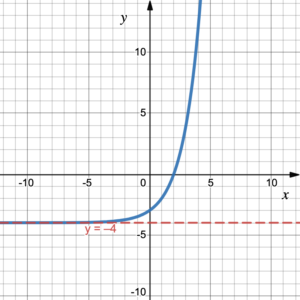
Use the graph to determine the function values [latex]g(x)[/latex] at the given [latex]x[/latex]-values.
- [latex]x=1[/latex]
- [latex]x=4[/latex]
- [latex]x=16[/latex]

Assigning the Function a Value
Determining the value of the independent variable
On the coordinate plane, when a function is assigned a value, it refers to the point on the graph where the [latex]y[/latex]-coordinate of the point is the assigned value. For example, [latex]f(x)=7[/latex], refers to a point on the graph where the [latex]y[/latex]-coordinate is 7. If we have the graph of the function we can find the corresponding [latex]x[/latex]-value of the function by determining the [latex]x[/latex]-coordinate of the point where [latex]y=7[/latex]. The graph in figure 3 shows that the point (3, 7) lies on the graph of the function. Therefore, when [latex]y=7,\; x=3[/latex]. This means that the function value of 7 occurs when the independent variable value is 3. The point (3, 7) is the point where the horizontal line [latex]y=7[/latex] intersects the graph [latex]y=f(x)[/latex].
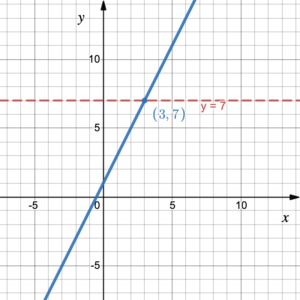
Figure 3. The [latex]x[/latex]-coordinate is 3 when [latex]f(x)=7[/latex]
We can also determine the [latex]x[/latex]-value algebraically, by setting [latex]f(x)=7[/latex] and solving the resulting equation for [latex]x[/latex].
[latex]f(x) = 2x + 1, \;\;7=2x+1,\;\; 6=2x, \;\;3=x[/latex]
This equation solving process to determine the value of an independent variable given a function value will be discussed throughout this entire course.
Example 3
Use the graph of the function [latex]y=f(x)[/latex] to determine the corresponding [latex]x[/latex]-values when:
- [latex]f(x)=8[/latex]
- [latex]f(x)=0[/latex]
- [latex]f(x)=6[/latex]

Solution
- The point where the horizontal line [latex]y=8[/latex] meets the graph is at the point (–1, 8). Therefore, [latex]x=-1[/latex] when [latex]f(x)=8[/latex].
- The point where the horizontal line [latex]y=0[/latex] (the [latex]x[/latex]-axis) meets the graph is at the point (3, 0). Therefore, [latex]x=3[/latex] when [latex]f(x)=0[/latex].
- The point where the horizontal line [latex]y=6[/latex] meets the graph is at the point (0, 6). Therefore, [latex]x=0[/latex] when [latex]f(x)=6[/latex].
Try It 3
Use the graph of the function [latex]y=g(x)[/latex] to determine the corresponding [latex]x[/latex]-values when:
- [latex]g(x)=4[/latex]
- [latex]g(x)=0[/latex]
- [latex]g(x)=-4[/latex]

Example 4
For [latex]T(x)=-2x+7[/latex], determine the corresponding [latex]x[/latex]-values when:
- [latex]T(x)=1[/latex]
- [latex]T(x)=-1[/latex]
- [latex]T(x)=9[/latex]
Solution
Set [latex]T(x)[/latex] equal to the given values and solve the resulting equation for [latex]x[/latex].
| T(x)=1 | T(x)=-1 | T(x)=9 |
|---|---|---|
| 1.
[latex]T(x)=-2x+7,\;\;1=-2x+7,\;\;-6=-2x,\;\;3=x[/latex] |
2.
[latex]T(x)=-2x+7,\;\;-1=-2x+7,\;\;-8=-2x,\;\;4=x[/latex] |
3.
[latex]T(x)=-2x+7,\;\;9=-2x+7,\;\;2=-2x,\;\;-1=x[/latex] |
Try It 4
For [latex]T(x)=3x-2[/latex], determine the corresponding [latex]x[/latex]-values when:
- [latex]T(x)=7[/latex]
- [latex]T(x)=0[/latex]
- [latex]T(x)=-11[/latex]
Candela Citations
- The Meaning of the Algebraic Form of a Function. Authored by: Leo Chang and Hazel McKenna. Provided by: Utah Valley University. License: CC BY: Attribution
- All graphs created using desmos graphing calculator. Authored by: Leo Chang and Hazel McKenna. Provided by: Utah Valley University. Located at: https://www.desmos.com/calculator. License: CC BY: Attribution