Learning Objectives
- Recognize graphical transformations:
- Shifting a graph vertically and horizontally
- Reflecting a graph across the [latex]x[/latex]-axis or [latex]y[/latex]-axis
- Stretching a graph vertically
- Compressing a graph vertically
- Determine an inverse function by switching [latex]x[/latex] and [latex]y[/latex] in coordinate pairs
- Graph an inverse function using symmetry
Transformations
The transformation of the graph of a function means shifting, flipping, stretching, or compressing a graph. The transformation keeps the same basic shape of the original graph; it has just been manipulated.
Shifting a Graph Vertically
In Figure 1, the graph with turning point at (1, 1) is shifted up 4 units so that the new turning point is (1, 5). In Figure 2, the graph with turning point at (0, 0) is shifted down 4 units so that the new turning point is (0, –4). Notice, in both cases, the [latex]x[/latex]-values do not change, only the [latex]y[/latex]-values shift up (Figure 1) or down (Figure 2). The graph stays exactly the same shape but has just been moved vertically. Each point on the graph keeps the same [latex]x[/latex]-value but move either up of down the same amount. In figure 1, shifting the graph up by 4 units means all points [latex](x, y)[/latex] move to [latex](x, y+4)[/latex]. In figure 2, moving the graph down 4 units means all points [latex](x, y)[/latex] move to [latex](x, y-4)[/latex].
|
Adding 4
|
Subtracting 4
|
|---|---|

Figure 1. Shifting up. |

FIgure 2. Shifting down. |
Example 1
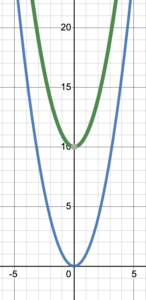
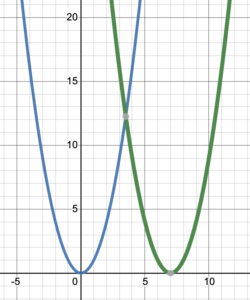
Explain which transformation the original (blue) graph has undergone to become the green graph. Write the new coordinates of a general point [latex](x,y)[/latex] after the transformation.
Solution
The original graph has been shifted up by 10 units. The turning point (0, 0) moves to (0, 10).
An original point [latex](x, y)[/latex] moves to [latex](x, y+10)[/latex].
Try It 1
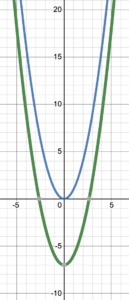
Explain which transformation the original (blue) graph has undergone to become the green graph. Write the new coordinates of a general point [latex](x,y)[/latex] after the transformation.
Shifting a Graph Horizontally
Shifting a graph vertically means to move the graph up or down without changing the shape of the graph. Similarly, shifting a graph horizontally means to move the graph left or right without changing the shape of the graph. In Figure 3, the graph with turning point (1, 1) is shifted to the right 5 units. The new turning point is (6, 1). Similarly, in Figure 4, the graph with turning point (1, 1) is shifted to the left 8 units. The new turning point is (-7, 1). Notice that when shifting horizontally, the graph stays the same shape and the [latex]y[/latex]-values do not change; only the [latex]x[/latex]-values move left (Figure 3) or right (Figure 4). A general point [latex](x, y)[/latex] on the graph in figure 3 moves to [latex](x+5, y)[/latex]. In figure 6, [latex](x, y)[/latex] moves to [latex](x-8, y)[/latex].
|
Subtracting 5
|
Adding 8
|
|---|---|
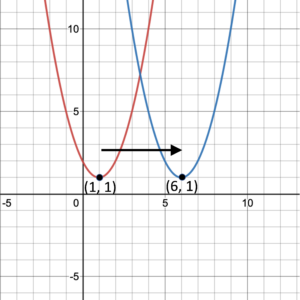
Figure 3. Shifting to the right. |
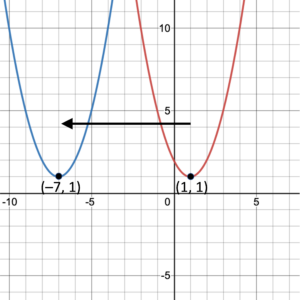
Figure 4. Shifting to the left. |
Example 2
Explain which transformation the original (blue) graph has undergone to become the green graph. Write the new coordinates of a general point [latex](x,y)[/latex] after the transformation.
Solution
The original graph has been shifted right by 7 units. The turning point (0, 0) moved to (7, 0).
An original point [latex](x, y)[/latex] will move to [latex](x+7, y)[/latex].
Try It 2
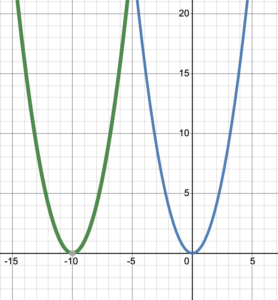
Explain which transformation the original (blue) graph has undergone to become the green graph. Write the new coordinates of a general point [latex](x,y)[/latex] after the transformation.
Shifting a Graph Vertically and Horizontally
We can shift a graph either horizontally or vertically, but we can also shift a graph horizontally and vertically. Consider the graphs in Figures 5 and 6. The graph in Figure 5 has been shifted up by 4 units and left by 3 units. This is shown by the turning point moving from (0, 0) to (–3, 4). Moving up 4 units adds 4 to the [latex]y[/latex]-coordinates, while moving left 3 units adds –3 to the [latex]x[/latex]-coordinates. This means that a general point [latex](x, y)[/latex] will move to [latex](x-3, y+4)[/latex]. Notice we would get the same result if we completed the transformations in the reverse order.
The graph in Figure 6 has been shifted right by 2 units and up by 3 units. The turning point moves from (0, 0) to (2, 3). Notice that all points on the graph move exactly the same way; right 2, up 3. For example, the point (–2, 4) moves to (0, 7). Moving 2 units right adds 2 to the [latex]x[/latex]-coordinates, while moving up 3 units adds 3 to the [latex]y[/latex]-coordinates. (–2, 4) moves to (–2 + 2, 4 + 3) = (0, 7). This means that a general point [latex](x, y)[/latex] will move to [latex](x+2, y+3)[/latex].
|
Shifting vertically and horizontally
|
Shifting horizontally and vertically
|
|---|---|

Figure 5. Vertical and horizontal shifts. |

Figure 6. Vertical and horizontal shifts. |
Example 3
Explain which transformation the original (blue) graph has undergone to become the green graph. Write the new coordinates of a general point [latex](x,y)[/latex] after the transformation.
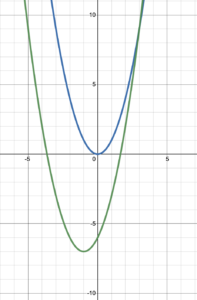
The original graph has been shifted left by 1 units and down by 7 units. The turning point at (0, 0) has moved to (–1 –7).
An original point [latex](x, y)[/latex] will move to [latex](x-1, y-7)[/latex].
Try It 3
Explain which transformation the original (blue) graph has undergone to become the green graph. Write the new coordinates of a general point [latex](x,y)[/latex] after the transformation.
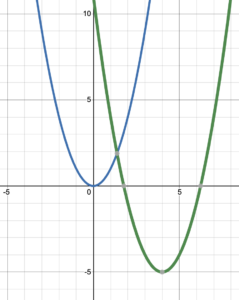
Reflecting a Graph Across the [latex]x[/latex]-axis
When a graph is reflected across the [latex]x[/latex]-axis, the [latex]y[/latex]-coordinates change sign while the [latex]x[/latex]-coordinates stay the same. So a general point [latex](x, y)[/latex] will move to [latex](x, -y)[/latex]. Notice in figure 7 only (0, 0) stays the same, and in Figure 8 only (–2, 0) stays the same. This is because their [latex]y[/latex]-coordinates are zero. In figure 8, the point (0, 4) moves to (0, –4) showing that the [latex]y[/latex]-coordinates change sign while the [latex]x[/latex]-coordinates stay the same.
|
Reflection of a parabola
|
Reflection of a line
|
|---|---|
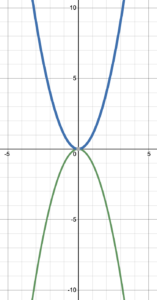
Figure 7. Reflecting across the [latex]x[/latex]-axis. |
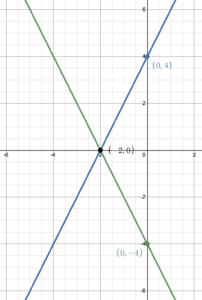
Figure 8. Reflecting across [latex]x[/latex]-axis. |
Example 4
A point (3, 4) lies on the graph of [latex]y=f(x)[/latex]. If the graph is reflected across the [latex]x[/latex]-axis, what happens to the point (3, 4)?
Solution
Reflecting a graph across the [latex]x[/latex]-axis results in the [latex]y[/latex]-coordinates changing sign while the [latex]x[/latex]-coordinates stay the same. So, (3, 4) moves to (3, –4).
Try It 4
A point (–3, –7) lies on the graph of [latex]y=g(x)[/latex]. If the graph is reflected across the [latex]x[/latex]-axis, what happens to the point (–3, –7)?
Reflecting a Graph Across the [latex]y[/latex]-axis
When a graph is reflected across the [latex]y[/latex]-axis, the [latex]x[/latex]-coordinates change sign while the [latex]y[/latex]-coordinates stay the same. So a general point [latex](x, y)[/latex] will move to [latex](-x, y)[/latex]. This is shown in figure 9 where the turning point (4, 0) moves to (–4, 0), and the point (7, 10) moves to (–7, 10).
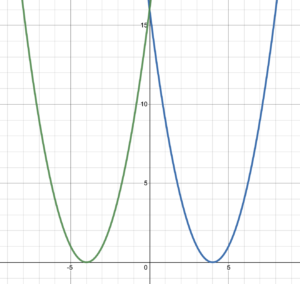
Figure 9. Reflecting across the [latex]y[/latex]-axis.
Example 5
A point (1, –5) lies on the graph of [latex]y=f(x)[/latex]. If the graph is flipped across the [latex]y[/latex]-axis, what happens to the point (1, –5)?
Solution
Flipping a graph across the [latex]y[/latex]-axis results in the [latex]x[/latex]-coordinates changing sign while the [latex]y[/latex]-coordinates stay the same. So, (1, –5) moves to (–1, –5).
Try It 5
A point (–3, 4) lies on the graph of [latex]y=g(x)[/latex]. If the graph is flipped across the [latex]y[/latex]-axis, what happens to the point (–3, 4)?
Stretching a Graph
When we stretch a graph we stretch it vertically so that it becomes longer and thinner. The only points that stay in the same position when we stretch a graph are the points on the [latex]x[/latex]-axis where [latex]f(x)=0[/latex]. Positive function values get larger (i.e., more positive) and negative function values get smaller (i.e., more negative). For example, figure 10 shows a graph that has been stretched by a factor of 3. The point (2, 4) on the original blue graph moves to (2, 12) on the green graph. This means that the [latex]y[/latex]-value in the stretched graph is 3 times greater than the [latex]y[/latex]-value in the original graph, when the [latex]x[/latex]-value stays the same. So a general point [latex](x, y)[/latex] moves to [latex](x, 3y)[/latex].
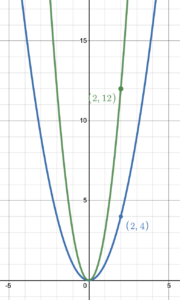
Figure 10. Stretched graph.
Example 6
A point (2, –5) lies on the graph of [latex]y=f(x)[/latex]. If the graph is stretched by a factor of 3, what happens to the point (2, –5)?
Solution
Stretching a graph by a factor of 3 means that the [latex]y[/latex]-coordinate gets multiplied by 3. So, (2, –5) moves to (2, –15).
Try It 6
A point (3, –4) lies on the graph of [latex]y=g(x)[/latex]. If the graph is stretched by a factor of 4, what happens to the point (3, –4)?
Compressing a Graph
Compressing a graph is related to stretching a graph, but instead of pulling the graph vertically, we squish it in a vertical direction (from top and bottom) so that it becomes shorter and fatter. Just like stretching, the only points on the graph that do not move are those on the [latex]x[/latex]-axis with a function value of zero. With compression, the positive function values will get smaller (but stay positive), and the negative function values will get less negative (but stay negative). For example, figure 11 shows a graph that has been compressed down to [latex]\frac{1}{4}[/latex] of its original height. This means that the [latex]y[/latex]-value in the compressed graph will be [latex]\frac{1}{4}[/latex] of the [latex]y[/latex]-value in the original graph. So a general point [latex](x, y)[/latex] will move to [latex](x, \frac{1}{4}y)[/latex].
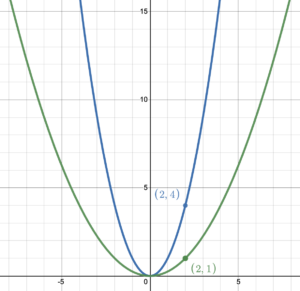
Figure 11. Compressed graph.
Example 7
A point (–2, 3) lies on the graph of [latex]y=f(x)[/latex]. If the graph is compressed to [latex]\dfrac{1}{3}[/latex] of its original height, what happens to the point (–2, 3)?
Solution
Compressing a graph to [latex]\frac{1}{3}[/latex] of its original height means that the [latex]y[/latex]-coordinate gets multiplied by [latex]\frac{1}{3}[/latex]. So, (–2, 3) moves to (–2, 1).
Try It 7
A point (9, –6) lies on the graph of [latex]y=g(x)[/latex]. If the graph is compressed to [latex]\frac{1}{2}[/latex] of its original height, what happens to the point (9, –6)?
Although we have mostly used similar graphs to show the different transformations, these transformations can be applied to the graph of any function.
For example, the blue function [latex]y=f(x)[/latex] is stretched by a factor of 5 in figure 12, and compressed to [latex]\dfrac{1}{2}[/latex] it’s height in figure 13. Every function value on the green stretched graph in figure 12 is 5 times the original function value. SImilarly, every function value on the green compressed graph in figure 13 is half of the original function value.The only points that do not move are those on the [latex]x[/latex]-axis where the function value is zero. Positive function values stay positive and negative function values stay negative.
|
Stretch
|
Compression
|
|---|---|

Figure 12. The parent function [latex]y=f(x)[/latex] is stretch by a factor of 5. |

Figure 13. The parent function [latex]y=f(x)[/latex] is compressed to one-half its height. |
Combining Transformations
The order of transformations
Transformations can be done in any order we want, but the order affects the result. If we are determining in which order to do them in order to transform a function into another specific function, the order matters. There are two types of transformations; vertical transformations that affect the function value and horizontal transformations that affect the independent variable ([latex]x[/latex]). Vertical and horizontal transformations are completed independently of one another. Horizontal transformations can be completed in any order. It is when we are completing vertical transformations when we have to be careful of the order. For example, shifting right by 3 units and up by 2 units combines a horizontal transformation with a vertical transformation, and they can be done in any order. Likewise, horizontal transformations can be completed in any order. For example, any function [latex]y=f(x)[/latex] can be transformed into [latex]y=f(-x+3)[/latex] by either reflecting the function [latex]y=f(x)[/latex] across the [latex]y[/latex]-axis then shifting the resulting function left by 3 units, or vice versa. Either way the result is the same. But if we were to combine only vertical transformations we have to be careful of the order in which they are completed. For example, if we shifted the function 4 units up then scaled the function by stretching it by a factor of 3, the [latex]y=f(x)[/latex] would transform first to [latex]y=f(x)+4[/latex] and then to [latex]y=3(f(x)+4)=3f(x)+12[/latex]. We would get a completely different result if we first stretched the function then shifted the function up, as [latex]y=f(x)[/latex] would transform first to [latex]y=3f(x)[/latex] and then to [latex]y=3f(x)+4[/latex].
The order of operations determines the order of the transformations.
A function may be shifted up or down, left or right, but such vertical or horizontal shifts should not be performed before the transformations of stretch (or compress) and reflection.
Considering points on the original function, if a point (1,1) is shifted up 6 units, it becomes (1, 7). If it is then stretched by a factor of 2, then the position of the point become (1, 14). On the other hand, if the point is first stretched by a factor of 2, it becomes (1, 2). When we then shift the graph up 6 units, it becomes (1, 8). You may notice that the result of the former (1, 14) is different from the result of the latter (1, 8). The former is stretched twice the size from its new vertical position (i.e., [latex]7\times2[/latex]). This means the shift has been stretched. Whereas the latter is shifted up after being stretched twice the size from its original vertical position (i.e., [latex]1\times2[/latex]). Therefore, to keep the correct scale of a stretch, stretch must be performed before vertical shifts.
The Order of transformations
We may be asked to write or graph a function with multiple transformations. In this case, we follow something similar to the order of operations.
Vertical Transformations are completed before horizontal transformations, with stretched, compressions and reflections completed before shifts:
- Multiplication to function: vertical stretches, compressions, and reflections, a
- Addition to function: vertical shifts, k
- Multiplication inside function (reflections across the [latex]y[/latex]-axis, [latex]b=-1[/latex])
- Addition inside Function: horizontal shifts, h
This shifts the original function [latex]y=f(x)[/latex] to [latex]y=a \cdot f(bx-h)+k[/latex]
Combining Transformations based on the Order of Transformations
For example, the graph of a function could be stretched by a factor of 2, moved horizontally right by 3 units, then moved vertically down by 6 units. Figure 14 shows a point (1, 1) on the blue curve being transformed first to (1, 2) when the graph is stretched by a factor of 2. The point (1, 2) is then transformed to (4, 2) when the graph is shifted horizontally right by 3 units. FInally the point (4, 2) gets shifted down by 6 units to (4, –4). If every point on the blue curve undergoes the same transformations, we will end up with the green curve.
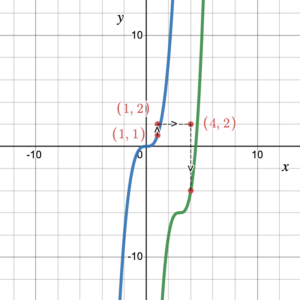
Figure 14. Multiple transformations
Any point [latex](x, y)[/latex] on the original green curve will first move to [latex](x,2y)[/latex] when the graph is stretched by a factor of 2, then that point will move to [latex](x+3,2y)[/latex] when the graph is moved horizontally right by 3 units. Finally, moving this point vertically down by 6 units will take the point to [latex](x+3, 2y-6)[/latex]. We can check this with the point (1, 1): [latex](x+3, 2y-6)=(1+3, 2(1)-6)=(4,-4)[/latex].
Example 8
The graph of a function is transformed by first compressing it to [latex]\frac{1}{4}[/latex] of its original height, then moving it vertically up by 3 units, then horizontally left by 5 units.
- What happens to the point (1, 4), which is on the original graph, after the transformations?
- What happens to a general point [latex](x, y)[/latex] on the original graph after the transformations?
Solution
- (1, 4) first moves to (1, 1) as compressing to [latex]\frac{1}{4}[/latex] of its original height, means we have to multiply the [latex]y[/latex]-values by [latex]\frac{1}{4}[/latex]. Then (1, 1) moves to (1, 4) when we move up by 3 units as we have to add 3 to the [latex]y[/latex]-coordinate. Finally, we have to subtract 5 from the [latex]x[/latex]-coordinate to move left by 5 units to (-4, 4).
- [latex](x, y)[/latex] first moves to [latex]\left (x, \dfrac{y}{4}\right)[/latex]. [latex]\left (x, \dfrac{y}{4}\right)[/latex] moves to [latex]\left (x, \dfrac{y}{4}+3\right)[/latex], which then moves to [latex]\left (x-5, \dfrac{y}{4}+3\right)[/latex].
Try It 8
The graph of a function is transformed by first reflecting it across the [latex]y[/latex]-axis, moving it vertically down by 3 units, then horizontally left by 7 units.
- What happens to the point (2, 5), which is on the original graph, after the transformations?
- What happens to a general point [latex](x, y)[/latex] on the original graph after the transformations?
Graphing Inverse Functions
We have already learned that an inverse function [latex]{f}^{-1}(x)[/latex] exists if the function [latex]f(x)[/latex] is one-to-one. We also learned that the range of the function [latex]f(x)[/latex] becomes the domain of the inverse function [latex]{f}^{-1}(x)[/latex], and the domain of [latex]f(x)[/latex] becomes the range of the inverse function [latex]{f}^{-1}(x)[/latex].

Figure 15. A mapping and its inverse.
This implies that when an inverse function is a set of ordered pairs with a one-to-one mapping, we find the inverse function by switching the [latex]x[/latex]– and [latex]y[/latex]-values. For example, if the original function is [latex]\{(1, 2), (2, 4), (3, 6), (4, 8), ...\}[/latex], the inverse function is [latex]\{(2, 1), (4, 2), (6, 3), (8, 4), ...\}[/latex]. Graphically, this function is an infinite set of coordinate points, so to graph the inverse function, we simply switch all the coordinate points.
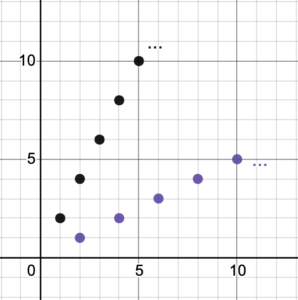
Figure 16. A function and its inverse.
The black dots represent the original function, while the purple dots represent the inverse function.
Graphing an inverse function
To graph the inverse function [latex]{f}^{-1}(x)[/latex], switch all coordinate pairs [latex](x, y)[/latex] where [latex]y=f(x)[/latex], to [latex](y, x)[/latex].
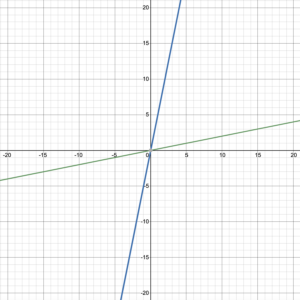
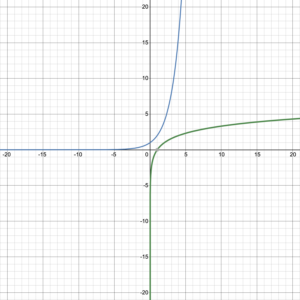
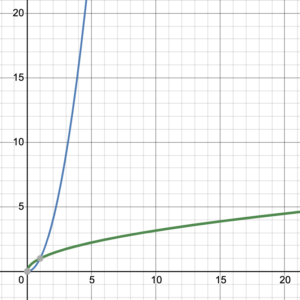
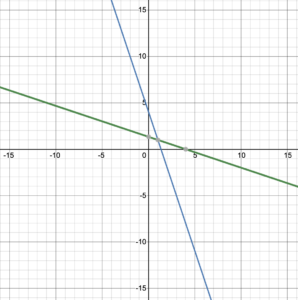
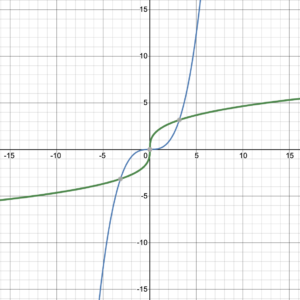
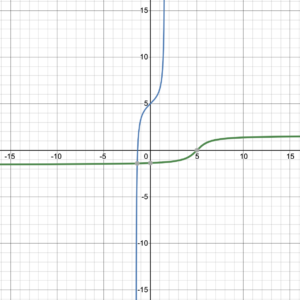
Consider the graphed one-to-one functions and their inverses in figure 17. The original function is graphed in blue, with the inverse function graphed in green.
| Line | Curve | Curve |
|---|---|---|
 |
 |
 |
 |
 |
 |
| Figure 17. Functions and their inverses. | ||
What do you notice about these graphs? Is there any type of symmetry?
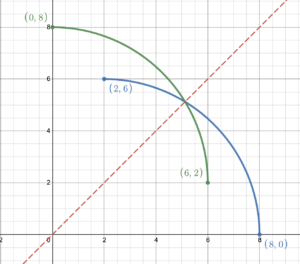
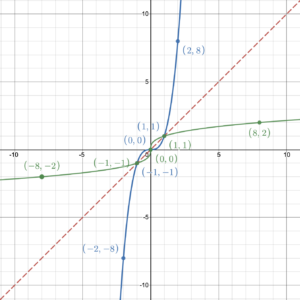
The graph of every one-to-one function and its inverse function are symmetric about the line [latex]y=x[/latex]. The line [latex]y=x[/latex] is a line of symmetry for inverse functions. Reflecting across the line [latex]y=x[/latex] causes the [latex]x[/latex]– and [latex]y[/latex]-coordinates to switch places, which is exactly what happens with a function and its inverse (figure 18).

Figure 18. A function and its inverse function.
Example 9
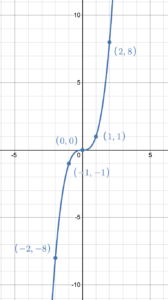
Use the graph of the function to sketch its inverse function.
Solution
Start by sketching the line [latex]y=x[/latex], then plot the given points with the coordinates switched. Finish by joining the points with a smooth curve mimicking the original graph as a mirror image.
Try It 9
Use the graph of the function to sketch its inverse function.
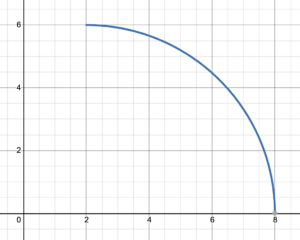
It is very important to remember that an inverse function exists only if the original function is a one-to-one function. If the original function is not a one-to-one function, it has no inverse function.
Candela Citations
- Transformations and the Inverse of a Function. Authored by: Leo Chang and Hazel McKenna. Provided by: Utah Valley University. License: CC BY: Attribution
- All graphs created using desmos graphing calculator. Authored by: Leo Chang and Hazel McKenna. Provided by: Utah Valley University. Located at: https://www.desmos.com/calculator. License: CC BY: Attribution
