Learning Outcomes
- Determine whether a solution reveals that a system has one, many, or no solutions
- Interpret the solution to a system of equations that represents profits for a business
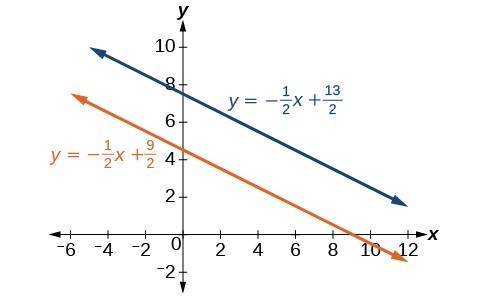
Now that we have several methods for solving systems of equations, we can use the methods to identify inconsistent systems. Recall that an inconsistent system consists of parallel lines that have the same slope but different [latex]y[/latex] -intercepts. They will never intersect. When searching for a solution to an inconsistent system, we will come up with a false statement, such as [latex]12=0[/latex].
Example: Solving an Inconsistent System of Equations
Solve the following system of equations.
[latex]\begin{gathered}&x=9 - 2y \\ &x+2y=13 \end{gathered}[/latex]
Try It
Solve the following system of equations in two variables.
[latex]\begin{gathered}2y - 2x=2\\ 2y - 2x=6\end{gathered}[/latex]
Expressing the Solution of a System of Dependent Equations Containing Two Variables
Recall that a dependent system of equations in two variables is a system in which the two equations represent the same line. Dependent systems have an infinite number of solutions because all of the points on one line are also on the other line. After using substitution or addition, the resulting equation will be an identity, such as [latex]0=0[/latex].
Example: Finding a Solution to a Dependent System of Linear Equations
Find a solution to the system of equations using the addition method.
[latex]\begin{gathered}x+3y=2\\ 3x+9y=6\end{gathered}[/latex]

Writing the general solution
In the previous example, we presented an analysis of the solution to the following system of equations:
[latex]\begin{gathered}x+3y=2\\ 3x+9y=6\end{gathered}[/latex]
After a little algebra, we found that these two equations were exactly the same. We then wrote the general solution as [latex]\left(x, -\frac{1}{3}x+\frac{2}{3}\right)[/latex]. Why would we write the solution this way? In some ways, this representation tells us a lot. It tells us that x can be anything, x is x. It also tells us that y is going to depend on x, just like when we write a function rule. In this case, depending on what you put in for x, y will be defined in terms of x as [latex]-\frac{1}{3}x+\frac{2}{3}[/latex].
In other words, there are infinitely many (x,y) pairs that will satisfy this system of equations, and they all fall on the line [latex]f(x)-\frac{1}{3}x+\frac{2}{3}[/latex].
Try It
Solve the following system of equations in two variables.
[latex]\begin{gathered}y - 2x=5 \\ -3y+6x=-15 \end{gathered}[/latex]
try it
Use an online graphing tool to write three different systems:
- A system of equations with one solution
- A system of equations with no solutions
- A system of equations with infinitely many solutions
![]()
Using Systems of Equations to Investigate Profits
Using what we have learned about systems of equations, we can return to the skateboard manufacturing problem at the beginning of the section. The skateboard manufacturer’s revenue function is the function used to calculate the amount of money that comes into the business. It can be represented by the equation [latex]R=xp[/latex], where [latex]x=[/latex] quantity and [latex]p=[/latex] price. The revenue function is shown in orange in the graph below.
The cost function is the function used to calculate the costs of doing business. It includes fixed costs, such as rent and salaries, and variable costs, such as utilities. The cost function is shown in blue in the graph below. The [latex]x[/latex] -axis represents quantity in hundreds of units. The y-axis represents either cost or revenue in hundreds of dollars.
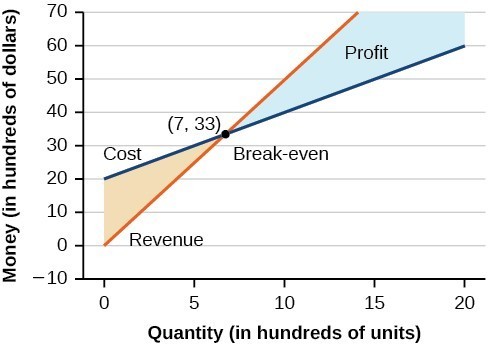
The point at which the two lines intersect is called the break-even point. We can see from the graph that if 700 units are produced, the cost is $3,300 and the revenue is also $3,300. In other words, the company breaks even if they produce and sell 700 units. They neither make money nor lose money.
The shaded region to the right of the break-even point represents quantities for which the company makes a profit. The shaded region to the left represents quantities for which the company suffers a loss. The profit function is the revenue function minus the cost function, written as [latex]P\left(x\right)=R\left(x\right)-C\left(x\right)[/latex]. Clearly, knowing the quantity for which the cost equals the revenue is of great importance to businesses.
Example: Finding the Break-Even Point and the Profit Function Using Substitution
Given the cost function [latex]C\left(x\right)=0.85x+35{,}000[/latex] and the revenue function [latex]R\left(x\right)=1.55x[/latex], find the break-even point and the profit function.


Writing a System of Linear Equations Given a Situation
It is rare to be given equations that neatly model behaviors that you encounter in business, rather, you will probably be faced with a situation for which you know key information as in the example above. Below, we summarize three key factors that will help guide you in translating a situation into a system.
How To: Given a situation that represents a system of linear equations, write the system of equations and identify the solution.
- Identify the input and output of each linear model.
- Identify the slope and y-intercept of each linear model.
- Find the solution by setting the two linear functions equal to another and solving for x, or find the point of intersection on a graph.
Now let’s practice putting these key factors to work. In the next example, we determine how many different types of tickets are sold given information about the total revenue and amount of tickets sold to an event.
Example: Writing and Solving a System of Equations in Two Variables
The cost of a ticket to the circus is $25.00 for children and $50.00 for adults. On a certain day, attendance at the circus is 2,000 and the total gate revenue is $70,000. How many children and how many adults bought tickets?
Try It
Meal tickets at the circus cost $4.00 for children and $12.00 for adults. If 1,650 meal tickets were bought for a total of $14,200, how many children and how many adults bought meal tickets?
Sometimes, a system of equations can inform a decision. In our next example, we help answer the question, “Which truck rental company will give the best value?”
Example: Building a System of Linear Models to Choose a Truck Rental Company
Jamal is choosing between two truck-rental companies. The first, Keep on Trucking, Inc., charges an up-front fee of $20, then 59 cents a mile. The second, Move It Your Way, charges an up-front fee of $16, then 63 cents a mile.[1] When will Keep on Trucking, Inc. be the better choice for Jamal?
The applications for systems seems almost endless, but we will just show one more. In the next example, we determine the amount 80% methane solution to add to a 50% solution to give a final solution of 60%.
Example: Solve a Chemical Mixture Problem
A chemist has 70 mL of a 50% methane solution. How much of a 80% solution must she add so the final solution is 60% methane?
Try IT
Candela Citations
- Revision and Adaptation. Provided by: Lumen Learning. License: CC BY: Attribution
- College Algebra. Authored by: Abramson, Jay et al.. Provided by: OpenStax. Located at: http://cnx.org/contents/9b08c294-057f-4201-9f48-5d6ad992740d@5.2. License: CC BY: Attribution. License Terms: Download for free at http://cnx.org/contents/9b08c294-057f-4201-9f48-5d6ad992740d@5.2
- Beginning and Intermediate Algebra. Authored by: Wallace, Tyler. Located at: http://www.wallace.ccfaculty.org/book/book.html. License: CC BY: Attribution
- Question ID 29699. Authored by: McClure, Caren. License: CC BY: Attribution. License Terms: IMathAS Community License CC-BY + GPL
- Question ID 15655. Authored by: Johns,Bryan, mb Lippman,David. License: CC BY: Attribution. License Terms: IMathAS Community License CC-BY + GPL
- Question ID 23774. Authored by: Shahbazian,Roy. License: CC BY: Attribution. License Terms: IMathAS Community License CC-BY + GPL
- Question ID 8589. Authored by: Harbaugh, Greg. License: CC BY: Attribution. License Terms: IMathAS Community License CC-BY + GPL
- Question ID 2239. Authored by: Morales,Lawrence, mb Sousa,James, mb Lippman,David. License: CC BY: Attribution. License Terms: IMathAS Community License CC-BY + GPL
- Precalculus. Authored by: OpenStax College. Provided by: OpenStax. Located at: http://cnx.org/contents/fd53eae1-fa23-47c7-bb1b-972349835c3c@5.175:1/Preface. License: CC BY: Attribution
- Rates retrieved Aug 2, 2010 from http://www.budgettruck.com and http://www.uhaul.com/ ↵