Learning Outcomes
- Graph stretches and compressions of logarithmic functions.
- Graph reflections of logarithmic functions.
Graphing Stretches and Compressions of [latex]y=\text{log}_{b}\left(x\right)[/latex]
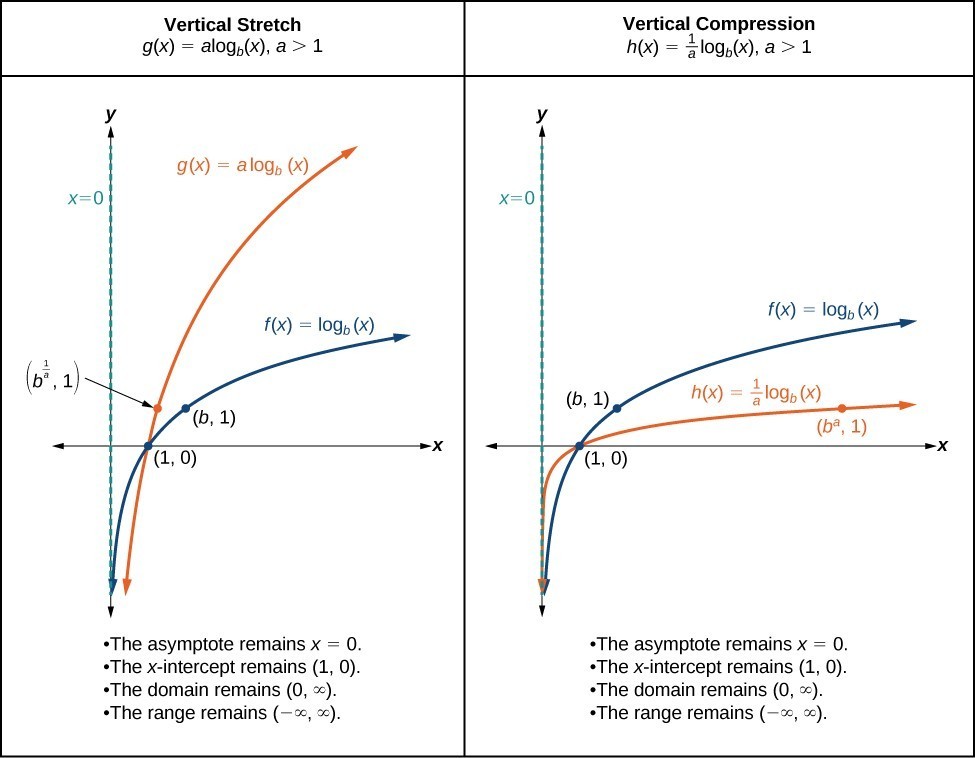
When the parent function [latex]f\left(x\right)={\mathrm{log}}_{b}\left(x\right)[/latex] is multiplied by a constant a > 0, the result is a vertical stretch or compression of the original graph. To visualize stretches and compressions, we set a > 1 and observe the general graph of the parent function [latex]f\left(x\right)={\mathrm{log}}_{b}\left(x\right)[/latex] alongside the vertical stretch, [latex]g\left(x\right)=a{\mathrm{log}}_{b}\left(x\right)[/latex], and the vertical compression, [latex]h\left(x\right)=\frac{1}{a}{\mathrm{log}}_{b}\left(x\right)[/latex].
A General Note: Vertical Stretches and Compressions of the Parent Function [latex]y=\text{log}_{b}\left(x\right)[/latex]
For any constant a > 1, the function [latex]f\left(x\right)=a{\mathrm{log}}_{b}\left(x\right)[/latex]
- stretches the parent function [latex]y={\mathrm{log}}_{b}\left(x\right)[/latex] vertically by a factor of a if a > 1.
- compresses the parent function [latex]y={\mathrm{log}}_{b}\left(x\right)[/latex] vertically by a factor of a if 0 < a < 1.
- has the vertical asymptote x = 0.
- has the x-intercept [latex]\left(1,0\right)[/latex].
- has domain [latex]\left(0,\infty \right)[/latex].
- has range [latex]\left(-\infty ,\infty \right)[/latex].
The graphs below summarize the key features of the resulting graphs of vertical stretches and compressions of logarithmic functions.
How To: Given a logarithmic function Of the form [latex]f\left(x\right)=a{\mathrm{log}}_{b}\left(x\right)[/latex], [latex]a>0[/latex], graph the Stretch or Compression
- Identify the vertical stretch or compression:
- If [latex]|a|>1[/latex], the graph of [latex]f\left(x\right)={\mathrm{log}}_{b}\left(x\right)[/latex] is stretched by a factor of a units.
- If [latex]|a|<1[/latex], the graph of [latex]f\left(x\right)={\mathrm{log}}_{b}\left(x\right)[/latex] is compressed by a factor of a units.
- Draw the vertical asymptote x = 0.
- Identify three key points from the parent function. Find new coordinates for the shifted functions by multiplying the y coordinates in each point by a.
- Label the three points.
- The domain is [latex]\left(0,\infty \right)[/latex], the range is [latex]\left(-\infty ,\infty \right)[/latex], and the vertical asymptote is x = 0.
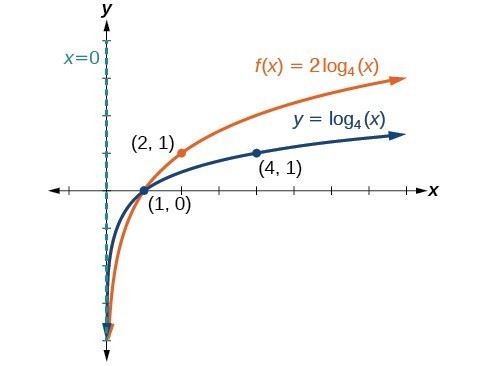
Example: Graphing a Stretch or Compression of the Parent Function [latex]y=\text{log}_{b}\left(x\right)[/latex]
Sketch the graph of [latex]f\left(x\right)=2{\mathrm{log}}_{4}\left(x\right)[/latex] alongside its parent function. Include the key points and asymptote on the graph. State the domain, range, and asymptote.
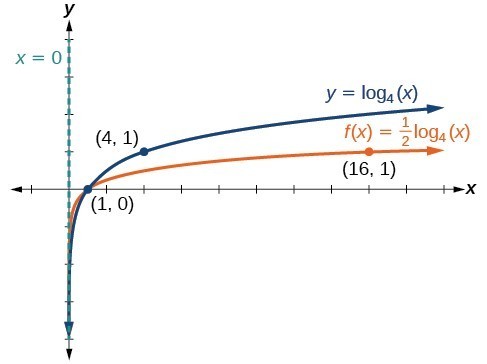
Try It
Sketch a graph of [latex]f\left(x\right)=\frac{1}{2}{\mathrm{log}}_{4}\left(x\right)[/latex] alongside its parent function. Include the key points and asymptote on the graph. State the domain, range, and asymptote.
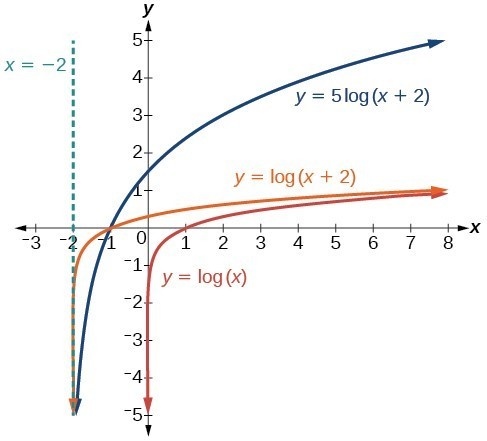
Example: Combining a Shift and a Stretch
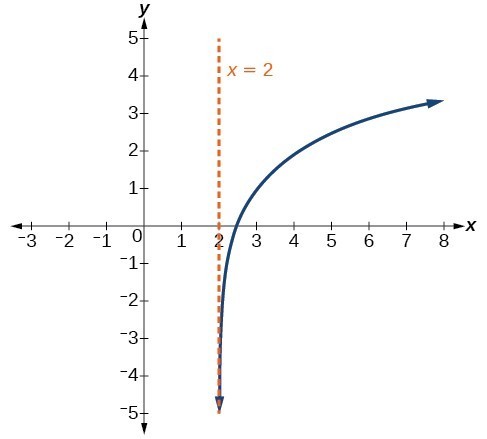
Sketch the graph of [latex]f\left(x\right)=5\mathrm{log}\left(x+2\right)[/latex]. State the domain, range, and asymptote.
Try It
Sketch a graph of the function [latex]f\left(x\right)=3\mathrm{log}\left(x - 2\right)+1[/latex]. State the domain, range, and asymptote.
Graphing Reflections of [latex]f\left(x\right)={\mathrm{log}}_{b}\left(x\right)[/latex]
When the parent function [latex]f\left(x\right)={\mathrm{log}}_{b}\left(x\right)[/latex] is multiplied by –1, the result is a reflection about the x-axis. When the input is multiplied by –1, the result is a reflection about the y-axis. To visualize reflections, we restrict b > 1 and observe the general graph of the parent function [latex]f\left(x\right)={\mathrm{log}}_{b}\left(x\right)[/latex] alongside the reflection about the x-axis, [latex]g\left(x\right)={\mathrm{-log}}_{b}\left(x\right)[/latex], and the reflection about the y-axis, [latex]h\left(x\right)={\mathrm{log}}_{b}\left(-x\right)[/latex].
A General Note: Reflections of the Parent Function [latex]y=\text{log}_{b}\left(x\right)[/latex]
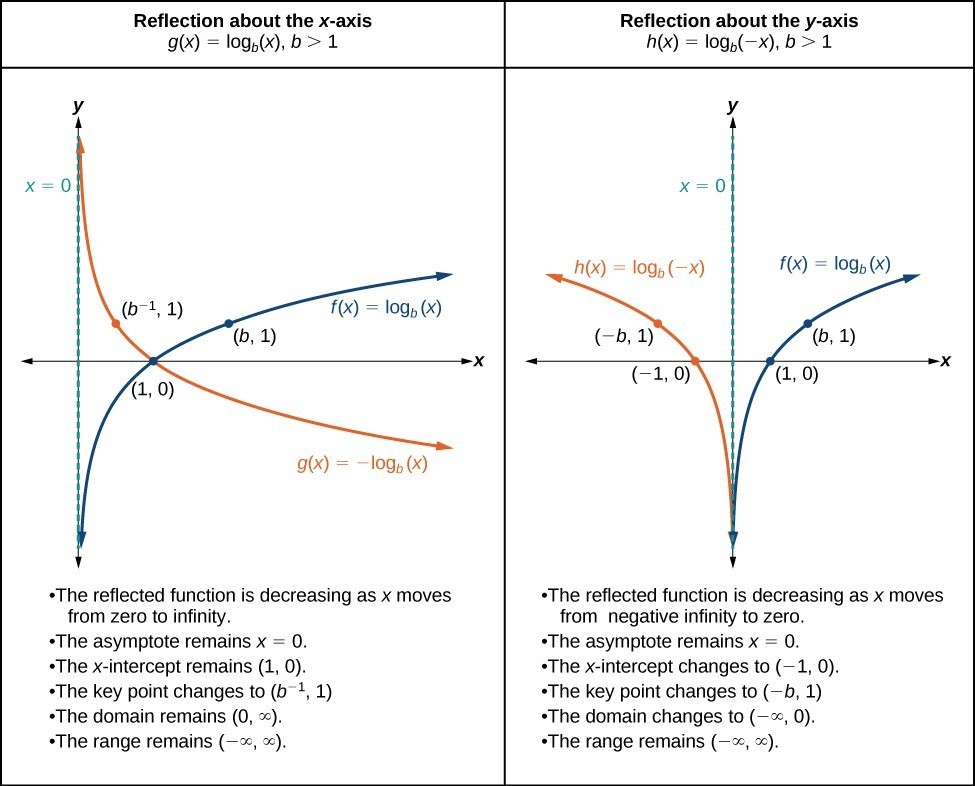
The function [latex]f\left(x\right)={\mathrm{-log}}_{b}\left(x\right)[/latex]
- reflects the parent function [latex]y={\mathrm{log}}_{b}\left(x\right)[/latex] about the x-axis.
- has domain [latex]\left(0,\infty \right)[/latex], range, [latex]\left(-\infty ,\infty \right)[/latex], and vertical asymptote x = 0 which are unchanged from the parent function.
The function [latex]f\left(x\right)={\mathrm{log}}_{b}\left(-x\right)[/latex]
- reflects the parent function [latex]y={\mathrm{log}}_{b}\left(x\right)[/latex] about the y-axis.
- has domain [latex]\left(-\infty ,0\right)[/latex].
- has range [latex]\left(-\infty ,\infty \right)[/latex] and vertical asymptote x = 0 which are unchanged from the parent function.
The graphs below summarize the key characteristics of reflecting [latex]f(x) = \log_{b}{x}[/latex] horizontally and vertically.
How To: Given a logarithmic function with the parent function [latex]f\left(x\right)={\mathrm{log}}_{b}\left(x\right)[/latex], graph a Reflection
| [latex]\text{If }f\left(x\right)=-{\mathrm{log}}_{b}\left(x\right)[/latex] | [latex]\text{If }f\left(x\right)={\mathrm{log}}_{b}\left(-x\right)[/latex] |
|---|---|
| 1. Draw the vertical asymptote, x = 0. | 1. Draw the vertical asymptote, x = 0. |
| 2. Plot the x-intercept, [latex]\left(1,0\right)[/latex]. | 2. Plot the x-intercept, [latex]\left(1,0\right)[/latex]. |
| 3. Reflect the graph of the parent function [latex]f\left(x\right)={\mathrm{log}}_{b}\left(x\right)[/latex] about the x-axis. | 3. Reflect the graph of the parent function [latex]f\left(x\right)={\mathrm{log}}_{b}\left(x\right)[/latex] about the y-axis. |
| 4. Draw a smooth curve through the points. | 4. Draw a smooth curve through the points. |
| 5. State the domain [latex]\left(0,\infty \right)[/latex], the range [latex]\left(-\infty ,\infty \right)[/latex], and the vertical asymptote x = 0. | 5. State the domain, [latex]\left(-\infty ,0\right)[/latex], the range, [latex]\left(-\infty ,\infty \right)[/latex], and the vertical asymptote x = 0. |
Example: Graphing a Reflection of a Logarithmic Function
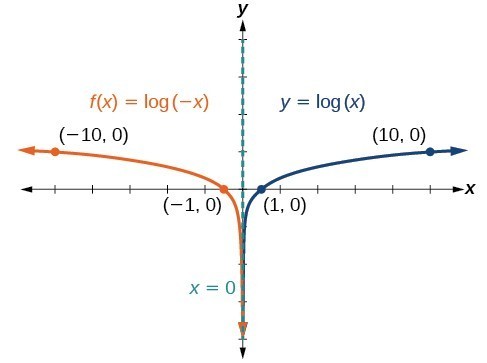
Sketch a graph of [latex]f\left(x\right)=\mathrm{log}\left(-x\right)[/latex] alongside its parent function. Include the key points and asymptote on the graph. State the domain, range, and asymptote.
Try It
Graph [latex]f\left(x\right)=-\mathrm{log}\left(-x\right)[/latex]. State the domain, range, and asymptote.
How To: Given a logarithmic equation, use a graphing calculator to approximate solutions
- Press [Y=]. Enter the given logarithmic equation or equations as Y1= and, if needed, Y2=.
- Press [GRAPH] to observe the graphs of the curves and use [WINDOW] to find an appropriate view of the graphs, including their point(s) of intersection.
- To find the value of x, we compute the point of intersection. Press [2ND] then [CALC]. Select “intersect” and press [ENTER] three times. The point of intersection gives the value of x for the point(s) of intersection.
Example: Approximating the Solution of a Logarithmic Equation
Solve [latex]4\mathrm{ln}\left(x\right)+1=-2\mathrm{ln}\left(x - 1\right)[/latex] graphically. Round to the nearest thousandth.
Try It
Solve [latex]5\mathrm{log}\left(x+2\right)=4-\mathrm{log}\left(x\right)[/latex] graphically. Round to the nearest thousandth.
Summarizing Transformations of Logarithmic Functions
Now that we have worked with each type of transformation for the logarithmic function, we can summarize each in the table below to arrive at the general equation for transforming exponential functions.
| Transformations of the Parent Function [latex]y={\mathrm{log}}_{b}\left(x\right)[/latex] | |
|---|---|
| Translation | Form |
Shift
|
[latex]y={\mathrm{log}}_{b}\left(x+c\right)+d[/latex] |
Stretch and Compression
|
[latex]y=a{\mathrm{log}}_{b}\left(x\right)[/latex] |
| Reflection about the x-axis | [latex]y=-{\mathrm{log}}_{b}\left(x\right)[/latex] |
| Reflection about the y-axis | [latex]y={\mathrm{log}}_{b}\left(-x\right)[/latex] |
| General equation for all transformations | [latex]y=a{\mathrm{log}}_{b}\left(x+c\right)+d[/latex] |
A General Note: Transformations of Logarithmic Functions
All transformations of the parent logarithmic function [latex]y={\mathrm{log}}_{b}\left(x\right)[/latex] have the form
[latex]f\left(x\right)=a{\mathrm{log}}_{b}\left(x+c\right)+d[/latex]
where the parent function, [latex]y={\mathrm{log}}_{b}\left(x\right),b>1[/latex], is
- shifted vertically up d units.
- shifted horizontally to the left c units.
- stretched vertically by a factor of |a| if |a| > 0.
- compressed vertically by a factor of |a| if 0 < |a| < 1.
- reflected about the x-axis when a < 0.
For [latex]f\left(x\right)=\mathrm{log}\left(-x\right)[/latex], the graph of the parent function is reflected about the y-axis.
Example: Finding the Vertical Asymptote of A LogarithmIC Function
What is the vertical asymptote of [latex]f\left(x\right)=-2{\mathrm{log}}_{3}\left(x+4\right)+5[/latex]?
Try It
What is the vertical asymptote of [latex]f\left(x\right)=3+\mathrm{ln}\left(x - 1\right)[/latex]?
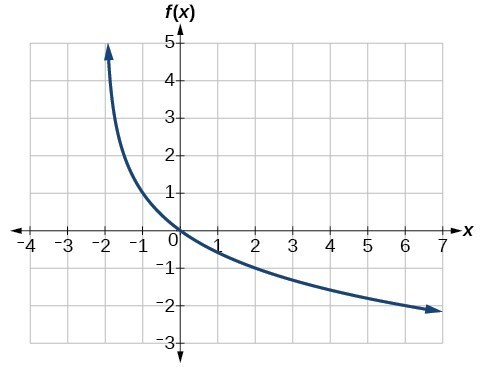
Example: Finding the Equation from a Graph
Find a possible equation for the common logarithmic function graphed below.
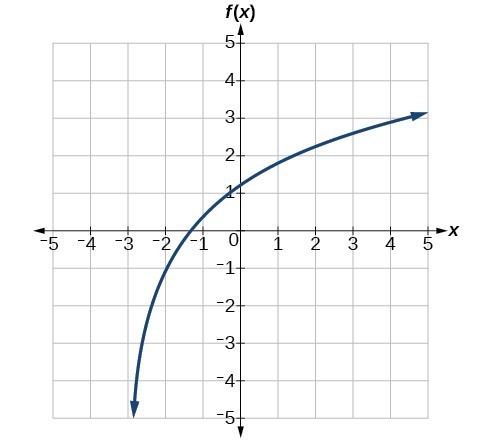
Try It
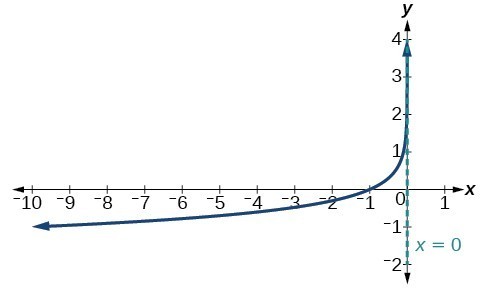
Give the equation of the natural logarithm graphed below.
Q & A
Is it possible to tell the domain and range and describe the end behavior of a function just by looking at the graph?
Yes if we know the function is a general logarithmic function. For example, look at the graph in the previous example. The graph approaches x = –3 (or thereabouts) more and more closely, so x = –3 is, or is very close to, the vertical asymptote. It approaches from the right, so the domain is all points to the right, [latex]\left\{x|x>-3\right\}[/latex]. The range, as with all general logarithmic functions, is all real numbers. And we can see the end behavior because the graph goes down as it goes left and up as it goes right. The end behavior is as [latex]x\to -{3}^{+},f\left(x\right)\to -\infty[/latex] and as [latex]x\to \infty ,f\left(x\right)\to \infty[/latex].
Candela Citations
- Revision and Adaptation. Provided by: Lumen Learning. License: CC BY: Attribution
- College Algebra. Authored by: Abramson, Jay et al.. Provided by: OpenStax. Located at: http://cnx.org/contents/9b08c294-057f-4201-9f48-5d6ad992740d@5.2. License: CC BY: Attribution. License Terms: Download for free at http://cnx.org/contents/9b08c294-057f-4201-9f48-5d6ad992740d@5.2