Learning Outcomes
- Graph horizontal and vertical shifts of logarithmic functions.
As we mentioned in the beginning of the section, transformations of logarithmic functions behave similar to those of other parent functions. We can shift, stretch, compress, and reflect the parent function [latex]y={\mathrm{log}}_{b}\left(x\right)[/latex] without loss of shape.
Graphing a Horizontal Shift of [latex]f\left(x\right)={\mathrm{log}}_{b}\left(x\right)[/latex]
When a constant c is added to the input of the parent function [latex]f\left(x\right)=\text{log}_{b}\left(x\right)[/latex], the result is a horizontal shift c units in the opposite direction of the sign on c. To visualize horizontal shifts, we can observe the general graph of the parent function [latex]f\left(x\right)={\mathrm{log}}_{b}\left(x\right)[/latex] alongside the shift left, [latex]g\left(x\right)={\mathrm{log}}_{b}\left(x+c\right)[/latex], and the shift right, [latex]h\left(x\right)={\mathrm{log}}_{b}\left(x-c\right)[/latex] where c > 0.
The graphs below summarize the changes in the x-intercepts, vertical asymptotes, and equations of a logarithmic function that has been shifted either right or left.
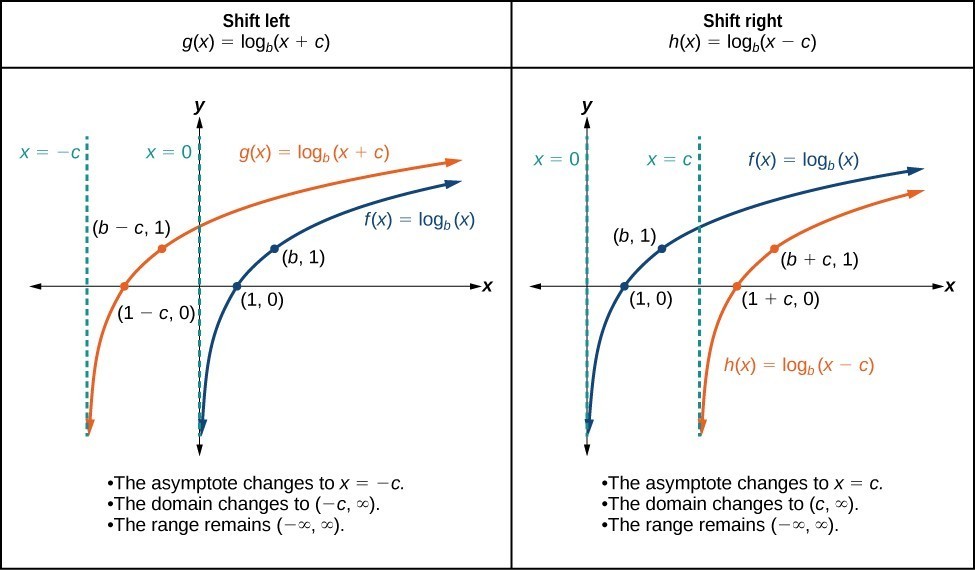
A General Note: Horizontal Shifts of the Parent Function [latex]y=\text{log}_{b}\left(x\right)[/latex]
For any constant c, the function [latex]f\left(x\right)={\mathrm{log}}_{b}\left(x+c\right)[/latex]
- shifts the parent function [latex]y={\mathrm{log}}_{b}\left(x\right)[/latex] left c units if c > 0.
- shifts the parent function [latex]y={\mathrm{log}}_{b}\left(x\right)[/latex] right c units if c < 0.
- has the vertical asymptote x = –c.
- has domain [latex]\left(-c,\infty \right)[/latex].
- has range [latex]\left(-\infty ,\infty \right)[/latex].
How To: Given a logarithmic function Of the form [latex]f\left(x\right)={\mathrm{log}}_{b}\left(x+c\right)[/latex], graph the Horizontal Shift
- Identify the horizontal shift:
- If c > 0, shift the graph of [latex]f\left(x\right)={\mathrm{log}}_{b}\left(x\right)[/latex] left c units.
- If c < 0, shift the graph of [latex]f\left(x\right)={\mathrm{log}}_{b}\left(x\right)[/latex] right c units.
- Draw the vertical asymptote x = –c.
- Identify three key points from the parent function. Find new coordinates for the shifted functions by subtracting c from the x coordinate in each point.
- Label the three points.
- The domain is [latex]\left(-c,\infty \right)[/latex], the range is [latex]\left(-\infty ,\infty \right)[/latex], and the vertical asymptote is x = –c.
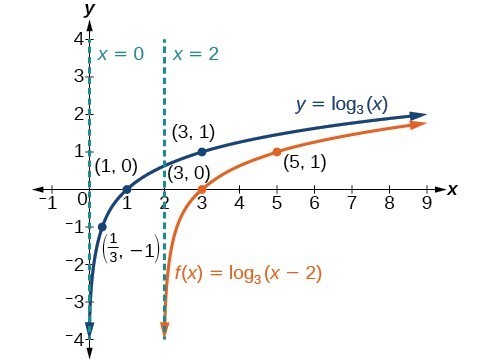
Example: Graphing a Horizontal Shift of the Parent Function [latex]y=\text{log}_{b}\left(x\right)[/latex]
Sketch the horizontal shift [latex]f\left(x\right)={\mathrm{log}}_{3}\left(x - 2\right)[/latex] alongside its parent function. Include the key points and asymptotes on the graph. State the domain, range, and asymptote.
Try It
Sketch a graph of [latex]f\left(x\right)={\mathrm{log}}_{3}\left(x+4\right)[/latex] alongside its parent function. Include the key points and asymptotes on the graph. State the domain, range, and asymptote.

Graphing a Vertical Shift of [latex]y=\text{log}_{b}\left(x\right)[/latex]
When a constant d is added to the parent function [latex]f\left(x\right)={\mathrm{log}}_{b}\left(x\right)[/latex], the result is a vertical shift d units in the direction of the sign of d. To visualize vertical shifts, we can observe the general graph of the parent function [latex]f\left(x\right)={\mathrm{log}}_{b}\left(x\right)[/latex] alongside the shift up, [latex]g\left(x\right)={\mathrm{log}}_{b}\left(x\right)+d[/latex], and the shift down, [latex]h\left(x\right)={\mathrm{log}}_{b}\left(x\right)-d[/latex].
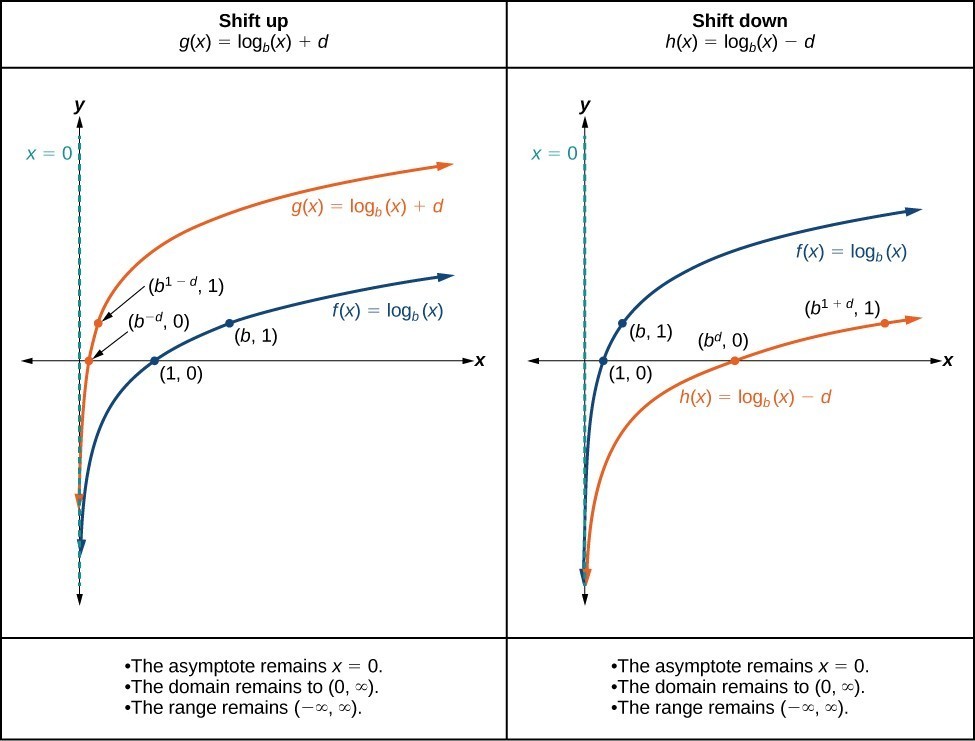
A General Note: Vertical Shifts of the Parent Function [latex]y=\text{log}_{b}\left(x\right)[/latex]
For any constant d, the function [latex]f\left(x\right)={\mathrm{log}}_{b}\left(x\right)+d[/latex]
- shifts the parent function [latex]y={\mathrm{log}}_{b}\left(x\right)[/latex] up d units if d > 0.
- shifts the parent function [latex]y={\mathrm{log}}_{b}\left(x\right)[/latex] down d units if d < 0.
- has the vertical asymptote x = 0.
- has domain [latex]\left(0,\infty \right)[/latex].
- has range [latex]\left(-\infty ,\infty \right)[/latex].
How To: Given a logarithmic function Of the form [latex]f\left(x\right)={\mathrm{log}}_{b}\left(x\right)+d[/latex], graph the Vertical Shift
- Identify the vertical shift:
- If d > 0, shift the graph of [latex]f\left(x\right)={\mathrm{log}}_{b}\left(x\right)[/latex] up d units.
- If d < 0, shift the graph of [latex]f\left(x\right)={\mathrm{log}}_{b}\left(x\right)[/latex] down d units.
- Draw the vertical asymptote x = 0.
- Identify three key points from the parent function. Find new coordinates for the shifted functions by adding d to the y coordinate of each point.
- Label the three points.
- The domain is [latex]\left(0,\infty \right)[/latex], the range is [latex]\left(-\infty ,\infty \right)[/latex], and the vertical asymptote is x = 0.
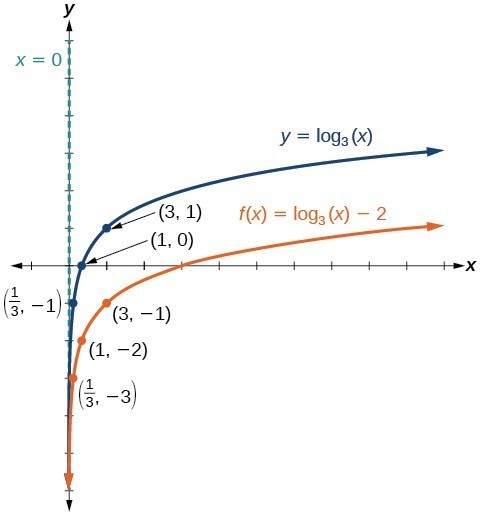
Example: Graphing a Vertical Shift of the Parent Function [latex]y=\text{log}_{b}\left(x\right)[/latex]
Sketch a graph of [latex]f\left(x\right)={\mathrm{log}}_{3}\left(x\right)-2[/latex] alongside its parent function. Include the key points and asymptote on the graph. State the domain, range, and asymptote.
Try It
Sketch a graph of [latex]f\left(x\right)={\mathrm{log}}_{2}\left(x\right)+2[/latex] alongside its parent function. Include the key points and asymptote on the graph. State the domain, range, and asymptote.

Candela Citations
- Revision and Adaptation. Provided by: Lumen Learning. License: CC BY: Attribution
- Question ID 74340, 74341. Authored by: Nearing,Daniel, mb Meacham,William, mb Lippman,David. License: CC BY: Attribution. License Terms: IMathAS Community License CC-BY +GPL
- College Algebra. Authored by: Abramson, Jay et al.. Provided by: OpenStax. Located at: http://cnx.org/contents/9b08c294-057f-4201-9f48-5d6ad992740d@5.2. License: CC BY: Attribution. License Terms: Download for free at http://cnx.org/contents/9b08c294-057f-4201-9f48-5d6ad992740d@5.2