Learning Outcomes
- Write the equation of a linear function given its graph
- Match linear functions with their graphs
- Find the x-intercept of a function given its equation
- Find the equations of vertical and horizontal lines
We previously wrote the equation for a linear function from a graph. Now we can extend what we know about graphing linear functions to analyze graphs a little more closely. Begin by taking a look at the graph below. We can see right away that the graph crosses the y-axis at the point (0, 4), so this is the y-intercept.
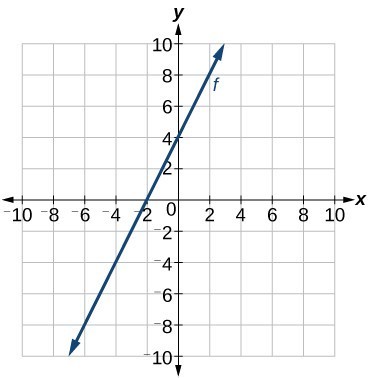
Then we can calculate the slope by finding the rise and run. We can choose any two points, but let’s look at the point (–2, 0). To get from this point to the y-intercept, we must move up 4 units (rise) and to the right 2 units (run). So the slope must be:
[latex]m=\frac{\text{rise}}{\text{run}}=\frac{4}{2}=2[/latex]
Substituting the slope and y-intercept into slope-intercept form of a line gives:
[latex]y=2x+4[/latex]
How To: Given THE graph of A linear function, find the equation to describe the function.
- Identify the y-intercept from the graph.
- Choose two points to determine the slope.
- Substitute the y-intercept and slope into slope-intercept form of a line.
Example: Matching Linear Functions to Their Graphs
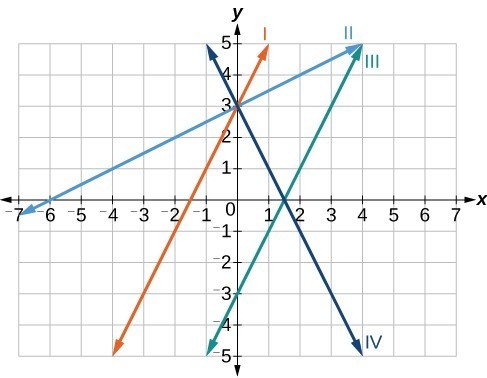
Match each equation of a linear function with one of the lines in the graph below.
- [latex]f\left(x\right)=2x+3[/latex]
- [latex]g\left(x\right)=2x - 3[/latex]
- [latex]h\left(x\right)=-2x+3[/latex]
- [latex]j\left(x\right)=\frac{1}{2}x+3[/latex]

Try It
Finding the x-intercept of a Line
So far we have been finding the y-intercepts of functions: the point at which the graph of a function crosses the y-axis. A function may also have an x-intercept, which is the x-coordinate of the point where the graph of a function crosses the x-axis. In other words, it is the input value when the output value is zero.
To find the x-intercept, set the function f(x) equal to zero and solve for the value of x. For example, consider the function shown:
[latex]f\left(x\right)=3x - 6[/latex]
Set the function equal to 0 and solve for x.
[latex]\begin{array}{l}0=3x - 6\hfill \\ 6=3x\hfill \\ 2=x\hfill \\ x=2\hfill \end{array}[/latex]
The graph of the function crosses the x-axis at the point (2, 0).
Q & A
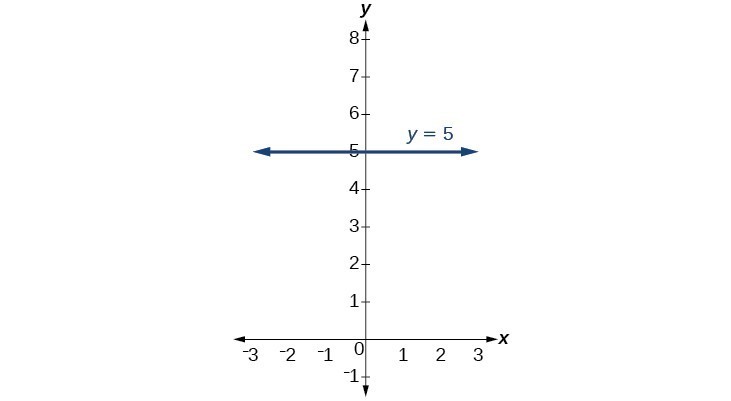
Do all linear functions have x-intercepts?
No. However, linear functions of the form y = c, where c is a nonzero real number are the only examples of linear functions with no x-intercept. For example, y = 5 is a horizontal line 5 units above the x-axis. This function has no x-intercepts.
A General Note: x-intercept
The x-intercept of a function is the value of x where f(x) = 0. It can be found by solving the equation 0 = mx + b.
Example: Finding an x-intercept
Find the x-intercept of [latex]f\left(x\right)=\frac{1}{2}x - 3[/latex].

Try It
Find the x-intercept of [latex]f\left(x\right)=\frac{1}{4}x - 4[/latex].
Describing Horizontal and Vertical Lines
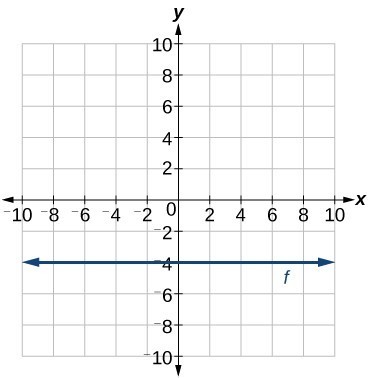
There are two special cases of lines on a graph—horizontal and vertical lines. A horizontal line indicates a constant output or y-value. In the graph below, we see that the output has a value of 2 for every input value. The change in outputs between any two points is 0. In the slope formula, the numerator is 0, so the slope is 0. If we use m = 0 in the equation [latex]f\left(x\right)=mx+b[/latex], the equation simplifies to [latex]f\left(x\right)=b[/latex]. In other words, the value of the function is a constant. This graph represents the function [latex]f\left(x\right)=2[/latex].
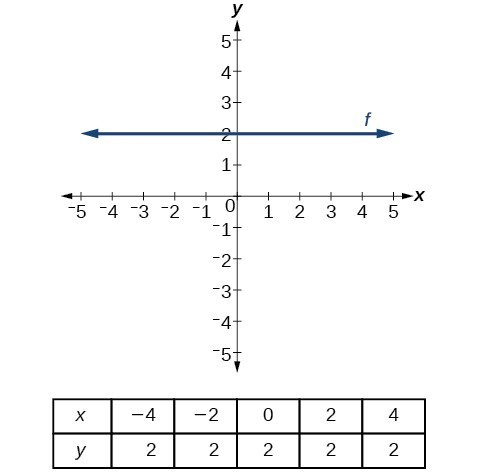
A horizontal line representing the function [latex]f\left(x\right)=2[/latex].
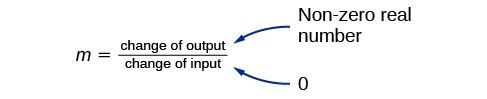
A vertical line indicates a constant input or x-value. We can see that the input value for every point on the line is 2, but the output value varies. Because this input value is mapped to more than one output value, a vertical line does not represent a function. Notice that between any two points, the change in the input values is zero. In the slope formula, the denominator will be zero, so the slope of a vertical line is undefined.
Notice that a vertical line has an x-intercept but no y-intercept unless it’s the line x = 0. This graph represents the line x = 2.
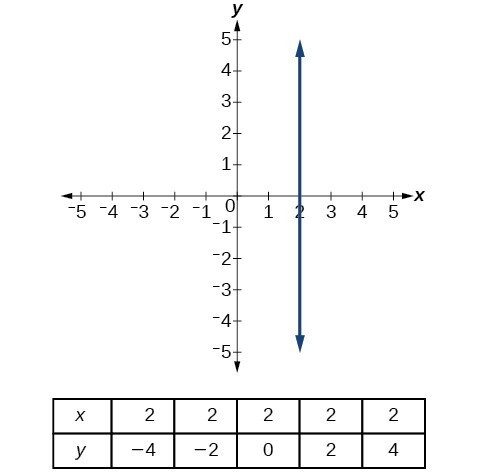
The vertical line [latex]x=2[/latex] which does not represent a function.
A General Note: Horizontal and Vertical Lines
Lines can be horizontal or vertical.
A horizontal line is a line defined by an equation of the form [latex]f\left(x\right)=b[/latex] where [latex]b[/latex] is a constant.
A vertical line is a line defined by an equation of the form [latex]x=a[/latex] where [latex]a[/latex] is a constant.
Example: Writing the Equation of a Horizontal Line
Write the equation of the line graphed below.
Try it
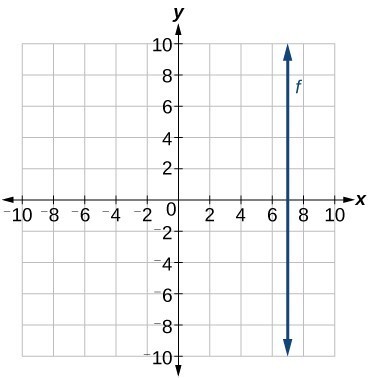
Example: Writing the Equation of a Vertical Line
Write the equation of the line graphed below.
Try It
Candela Citations
- Revision and Adaptation. Provided by: Lumen Learning. License: CC BY: Attribution
- Slope Interactive. Authored by: Lumen Learning. Located at: https://www.desmos.com/calculator/7ighwgcjyi. License: Public Domain: No Known Copyright
- Precalculus. Authored by: Jay Abramson, et al.. Provided by: OpenStax. Located at: http://cnx.org/contents/fd53eae1-fa23-47c7-bb1b-972349835c3c@5.175. License: CC BY: Attribution. License Terms: Download For Free at : http://cnx.org/contents/fd53eae1-fa23-47c7-bb1b-972349835c3c@5.175.
- College Algebra. Authored by: Abramson, Jay et al.. Provided by: OpenStax. Located at: http://cnx.org/contents/9b08c294-057f-4201-9f48-5d6ad992740d@5.2. License: CC BY: Attribution. License Terms: Download for free at http://cnx.org/contents/9b08c294-057f-4201-9f48-5d6ad992740d@5.2
- Question ID 1440. Authored by: unknown, mb Lippman,David. License: CC BY: Attribution. License Terms: IMathAS Community License CC-BY + GPL
- Question ID 79757. Authored by: Lumen Learning. License: CC BY: Attribution. License Terms: IMathAS Community License CC-BY + GPL
- Question ID 15599. Authored by: Johns,Bryan. License: CC BY: Attribution. License Terms: IMathAS Community License CC-BY + GPL
- Question ID 114592. Authored by: Lumen Learning. License: CC BY: Attribution. License Terms: IMathAS Community License CC-BY + GPL