Learning Outcomes
- Use the least-squares regression method to create a regression line on a graph of cost data
This method uses all of the data available to separate the fixed and variable portions of a mixed cost. A regression line is fitted into the data using the following formula:
Y= a + bX
Y= Maintenance costs
X= Number of dogs groomed
a= the total fixed cost
b= the variable cost per unit of activity
So using this calculator.
If you use the data from the dog groomer example you should be able to calculate the following chart:
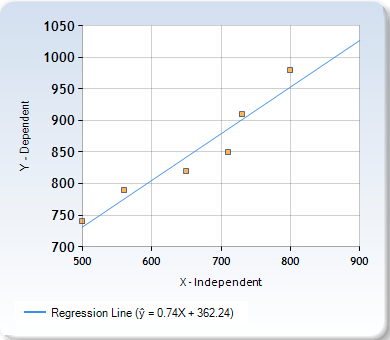
This method is more accurate, using all of the available data. The table below shows the difference in calculation using the two methods:
| Costs | High-low | Least Squares Regression Method |
|---|---|---|
| Variable cost estimate per dog groomed | $.080 | $.074 |
| Fixed cost estimate per month | $340 | $362.24 |
Practice Questions
Candela Citations
CC licensed content, Original
- Least Squares Regression Method. Authored by: Freedom Learning Group. Provided by: Lumen Learning. License: CC BY: Attribution