Learning outcomes
Create workbooks and format data in Google Sheets
Google Sheets is very similar to Microsoft Excel. Perhaps the greatest difference between the two is Google Sheets’ online functionality, which allows for real-time collaboration. Additionally, as Google Sheets is a free online tool, you can be assured everyone you’ll work with has or can get access to Google Sheets, as long as they have the internet.
In Google Sheets, the creation of a spreadsheet, the manipulation of data, and the type of use and results are all very similar to usage in Microsoft Excel. Below is a screenshot of a raw and unused Google Sheet. Note the same columns and rows orientation, various ways to adjust the display of numerical data via the menu bar buttons, and formula buttons along the top bar (Figure 1).
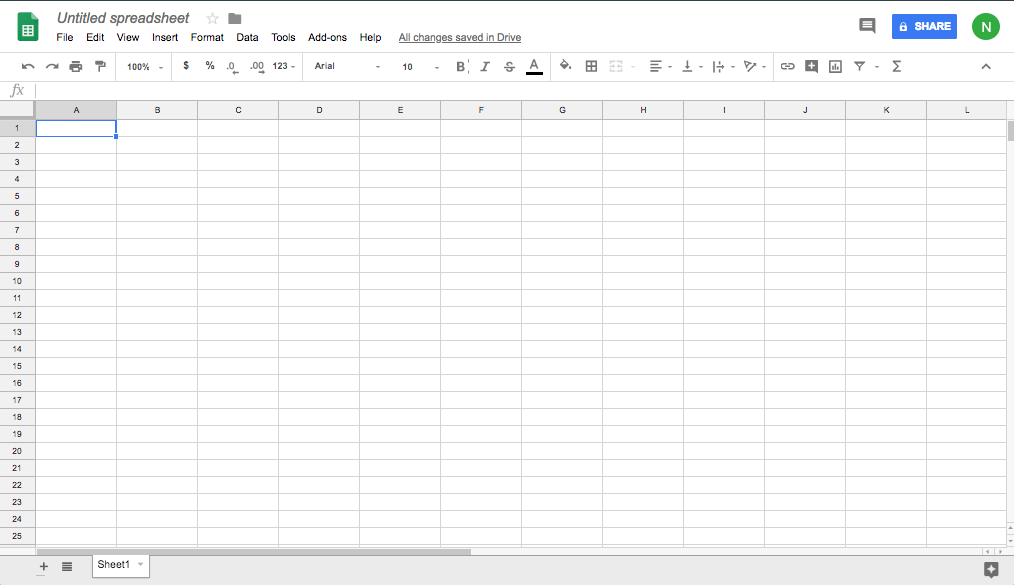
Figure 1. A new spreadsheet in Google Sheets
Learning to use Sheets is similarly helpful to learning Excel; both use the same type of data organization and manipulation, and creating a worksheet is nearly identical. Many of the skills you learned for Excel can also be applied to Google Sheets, such as basic text formatting. File extensions for Google work differently, and arguably a strength of Google Sheets over Microsoft is the ability to collaborate in the cloud real time on a given sheet.
In this page, you will learn the basics of using Google Sheets, focused on rearranging information into tables and changing style elements.
Practice Question
Creating a New Speadsheet
You can open Google Sheets by logging into Google Drive on any web browser or by going directly to sheets.google.com. Once there, you’ll be taken to the Google Sheets home screen (Figure 2).
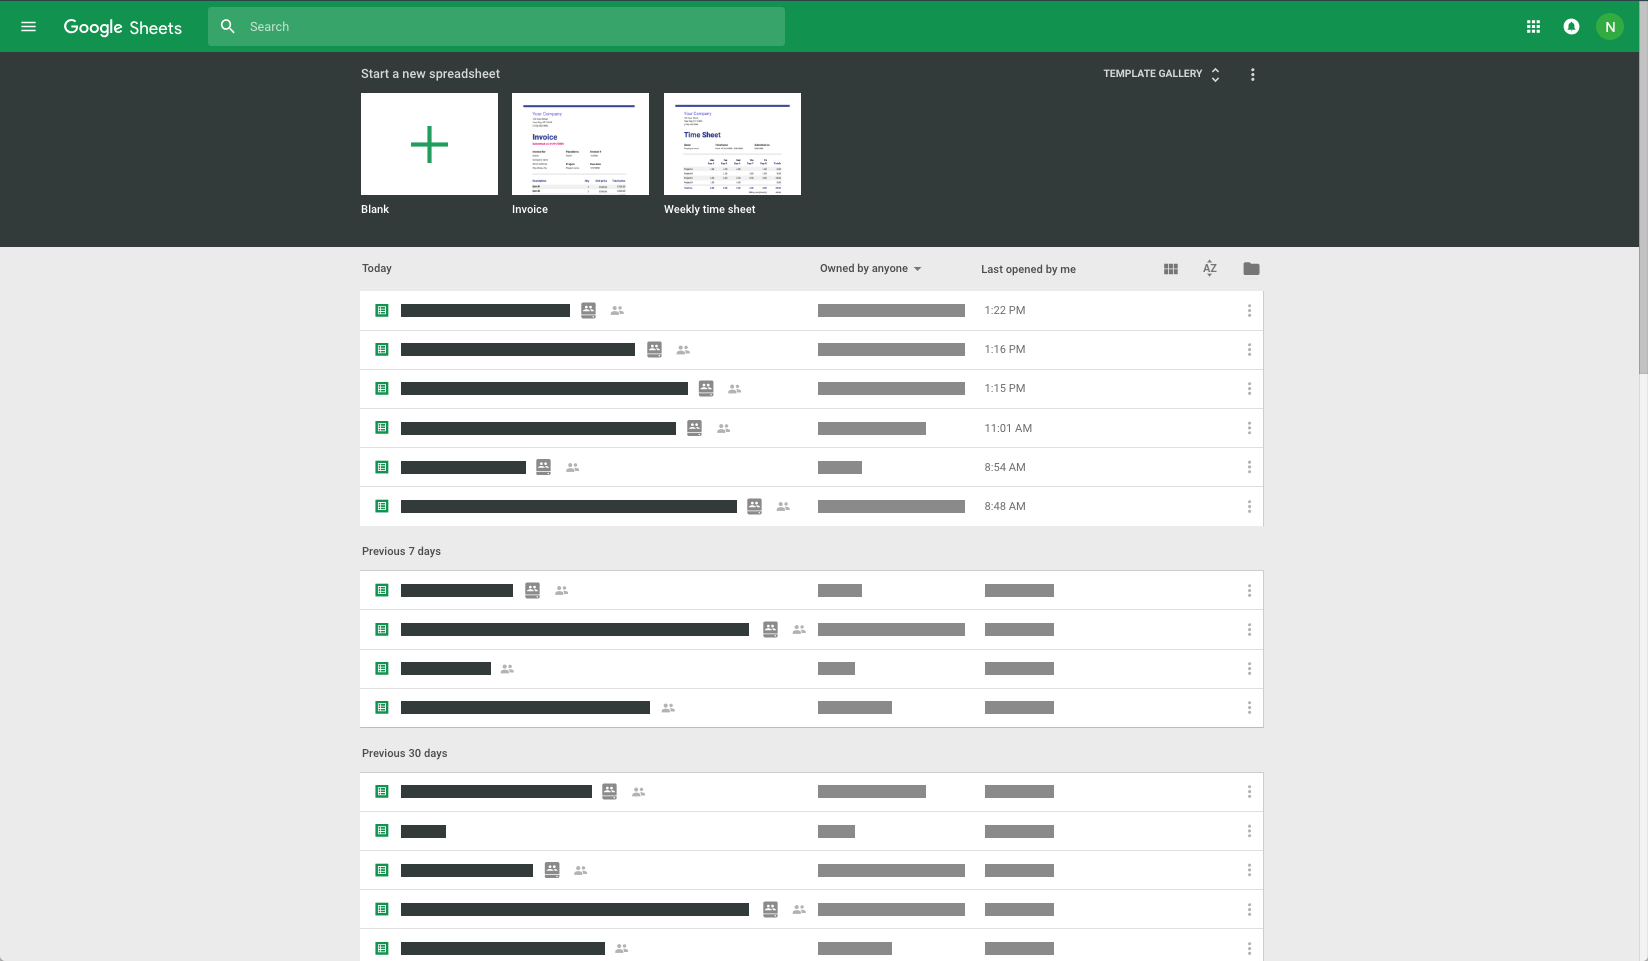
Figure 2. Creating a new spreadsheet
To create a new Google Sheet, click on the blank tile with the large green + symbol (as seen in the upper left of Figure 2). This will open a new sheet identical to the blank sheet seen in Figure 1.
Using Google Sheets
Most of what you see is very similar to Excel. Arguably, Excel has more functionality, and it probably should be used if large data crunching—pages and pages of data—is necessary. For minor data analysis, or for looking at flow charts or other data visually, Google Sheets is probably better than Excel. This is true particularly if you consider the robust sharing features that come with Google Drive. Microsoft Office also has online, cloud-based sharing. Our recommendation would be to experiment with both for your research needs.
Like Excel, Sheets has the following exact terms:
- Cell. This is the area where you will enter data.
- Row. Rows are cells aligned horizontally.
- Column. Columns are cells aligned vertically.
- Worksheet. A worksheet is a single page within a workbook. Like the tabs in an internet browser, the tabs in a Google Sheets workbook show different pages, or worksheets. A workbook may have many worksheets included in it. In this screenshot, the workbook has only one worksheet and one tab, which is labeled Sheet1. The selected tab shows the selected worksheet. Clicking the + button will add another worksheet. Saving is automatic in Google; when you build more sheets, they will all be saved in that workbook.
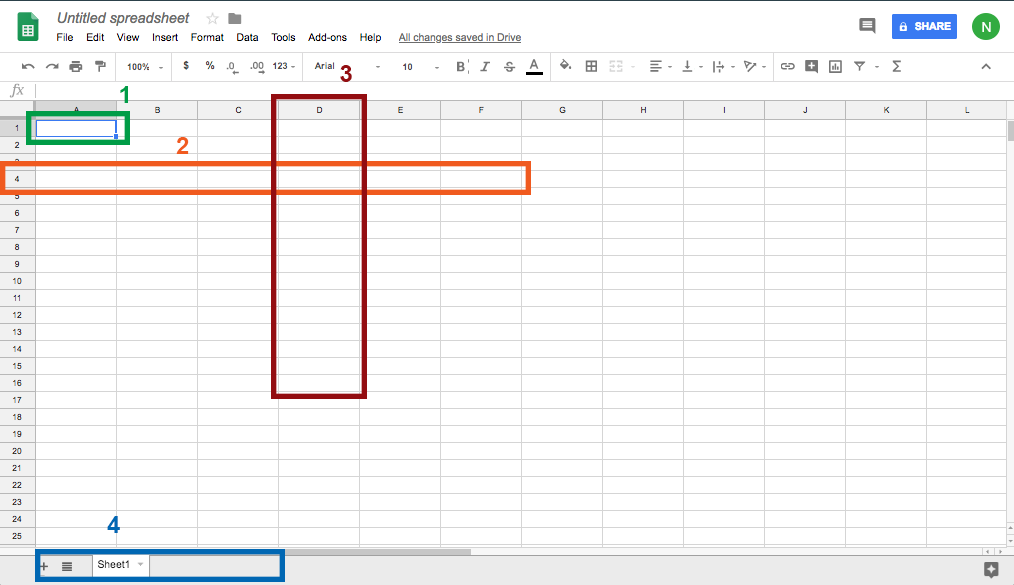
Figure 3. Four primary components of a spreadsheet
Add-ons
While the majority of Google Sheets is almost identical to Microsoft Excel, there are notable differences. The primary difference we’ll focus on here are Google Sheets add-ons, which you can access in a drop-down menu (Figure 4).
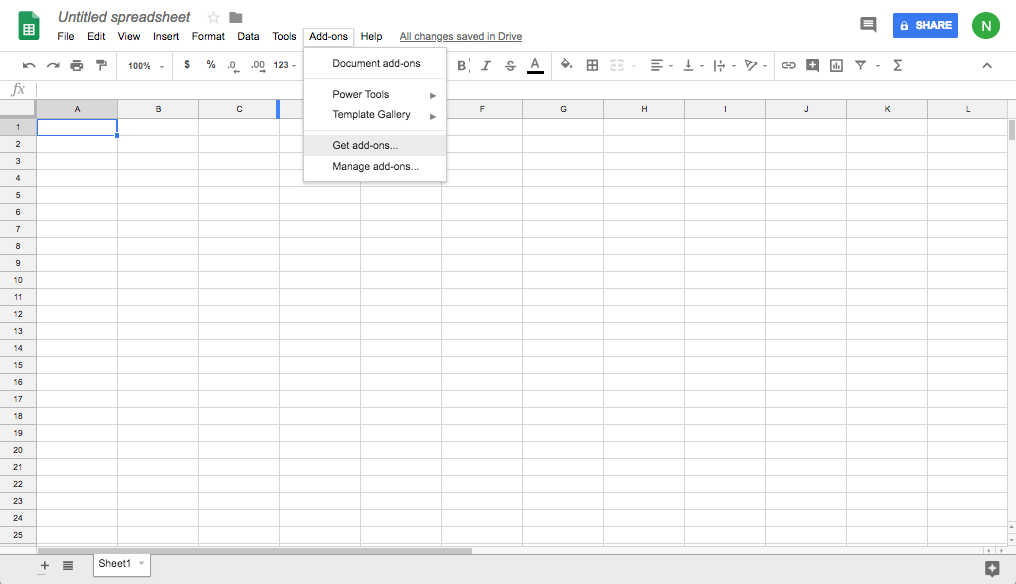
Figure 4. Add-ons are accessible through the menu bar
A strength of Google Drive, and Google’s office suite writ large, is the addition of third party add-ons. These range from styles that can change the look and feel of a given Sheet (see Figure 5), to the addition of macros or tools that help with grading or other type of data analysis. Depending on your data and goals for using the data, you can choose from literally thousands of options. If you are looking for a particular functionality, you can use the search bar in the upper-right corner of the add-ons window (Figure 5).
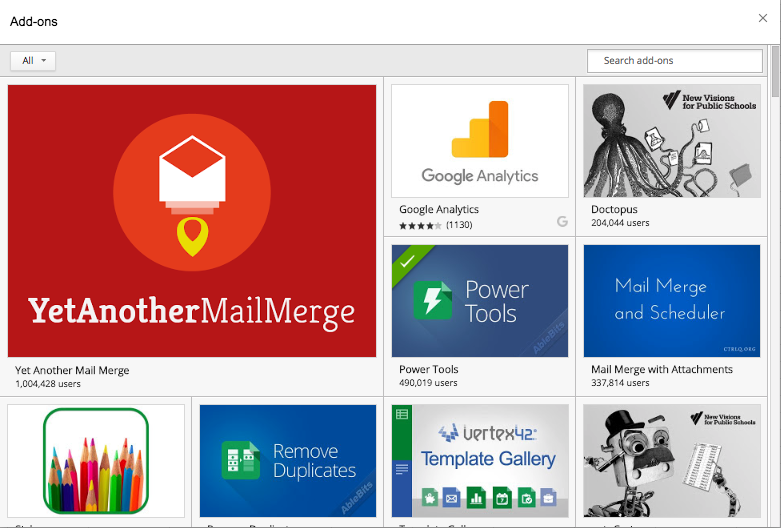
Figure 5. There are a huge variety of add-ons available in Google Sheets.
These add-ons can be used for a variety of purposes, most of which revolve around adding or “popping” functionality into the spreadsheet itself.
Vertex Template Gallery
The Vertex Template Gallery (seen in the bottom row of Figure 5) gives you the option to use several pre-built templates ranging from project management/waterfall planning tools, to budget sheets and even survey forms.
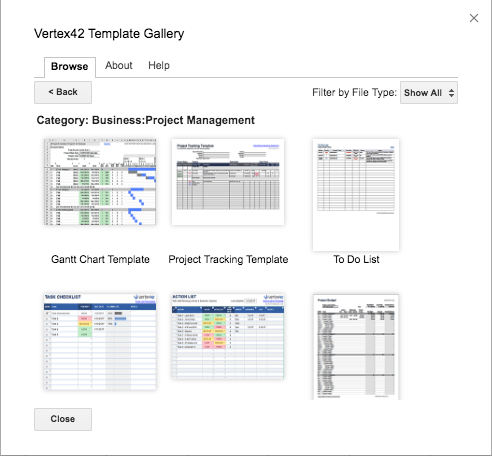
Figure 6. Templates available through Vertex Template Gallery
For your business research needs, there are a few key strengths of Google Sheets to consider. Michael Ansaldo, of PC World, wrote that users should consider Sheets when the following are key aspects of your project:[1]
- Cost: Google is free to use, which can be particularly useful for smaller or newer teams where money is often much tighter.
- Collaboration: Google Sheets is better suited to collaboration between multiple parties, particularly if you need to write on the same spreadsheet in real time from various computers and places. Using a shared spreadsheet can cut down on time and confusion.
- Google Integration. Google has created a host of tools that provide unique functions, and these tools can integrate seamlessly with Google Sheets.
- Tracking Changes. Google Sheets automatically keeps track of the version history of a document, as well as keeping track of who made changes (as long as a user is signed in).
In his article, Anslado expands on the utility of Google integration:[2]
Because of its tight integration with Google, Sheets can import all kinds of data from other Google services and the web at large. You can translate the contents of a cell using the function GOOGLETRANSLATE(), or you can fetch current or historical securities info from Google Finance with the function GOOGLEFINANCE(). And with Sheets IMPORTFEED and IMPORTDATA functions, you can pull information from the internet directly into your spreadsheet.
In Summary
Both Microsoft Excel and Google Sheets are excellent spreadsheet tools. Both have similar functionality, and use formulas to “crunch” quantitative data. Arguably for business report writing, Google Sheets might be better, especially if there is a need to collaborate on the same sheet in real time.
Candela Citations
- Google Sheets. Authored by: Freedom Learning Group. Provided by: Lumen Learning. License: CC BY: Attribution
- Ansaldo, Michael. "Microsoft Excel vs. Google Sheets: The 4 key ways Sheets beats Excel." PCWorld. Sep 28, 2015. Web. 12 June 2018. ↵
- Ibid. ↵
