Learning Outcomes
- Modify chart type.
Once you have created a chart, or if you are given a worksheet that contains a chart, it is very easy to change the chart type.
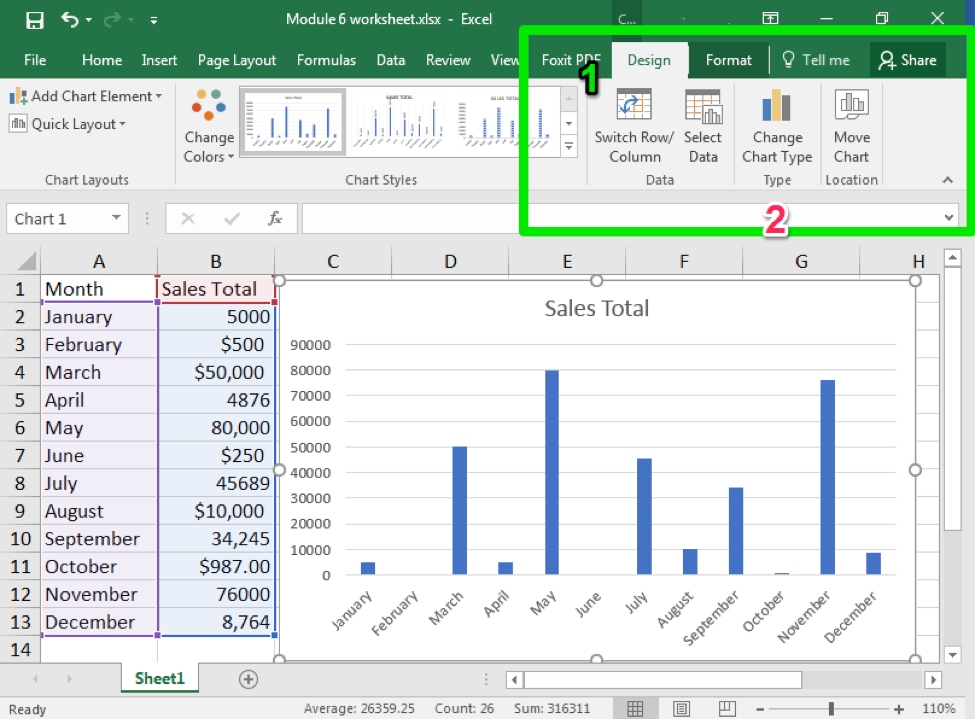
- Click on the chart you wish to change. The Design tab should appear in the ribbon area.
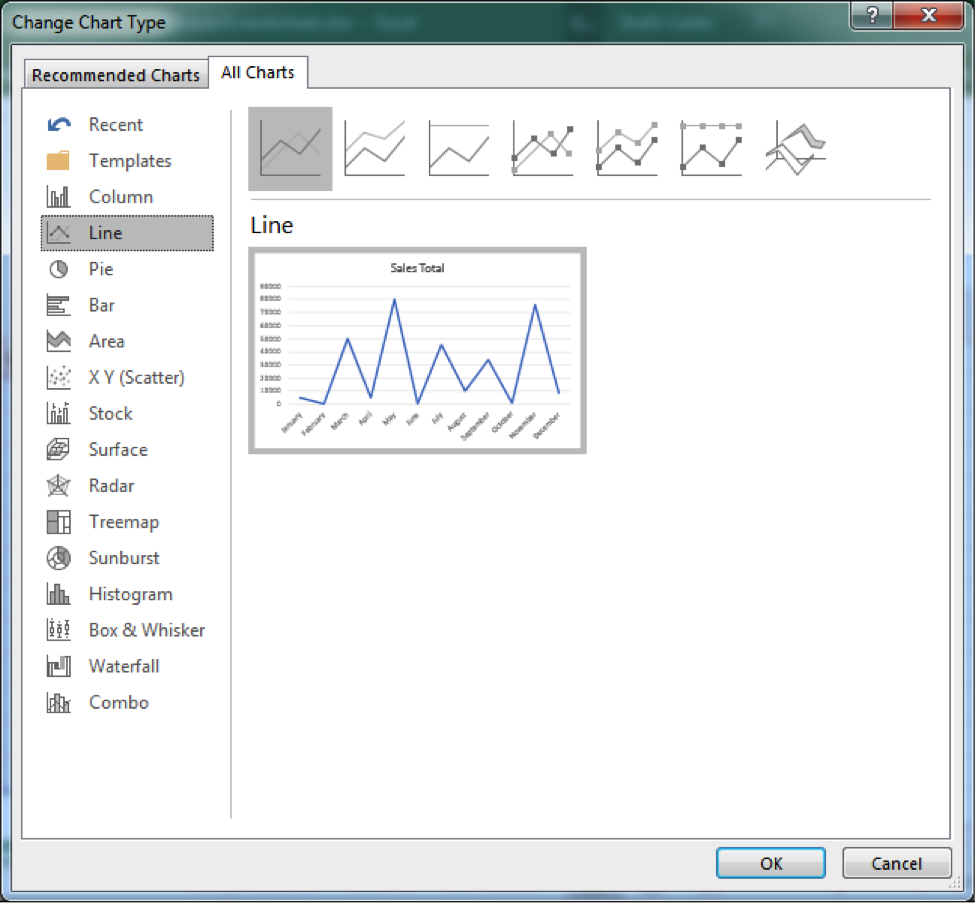
- Click on Change Chart Type button
- Click on the type of chart you would like.
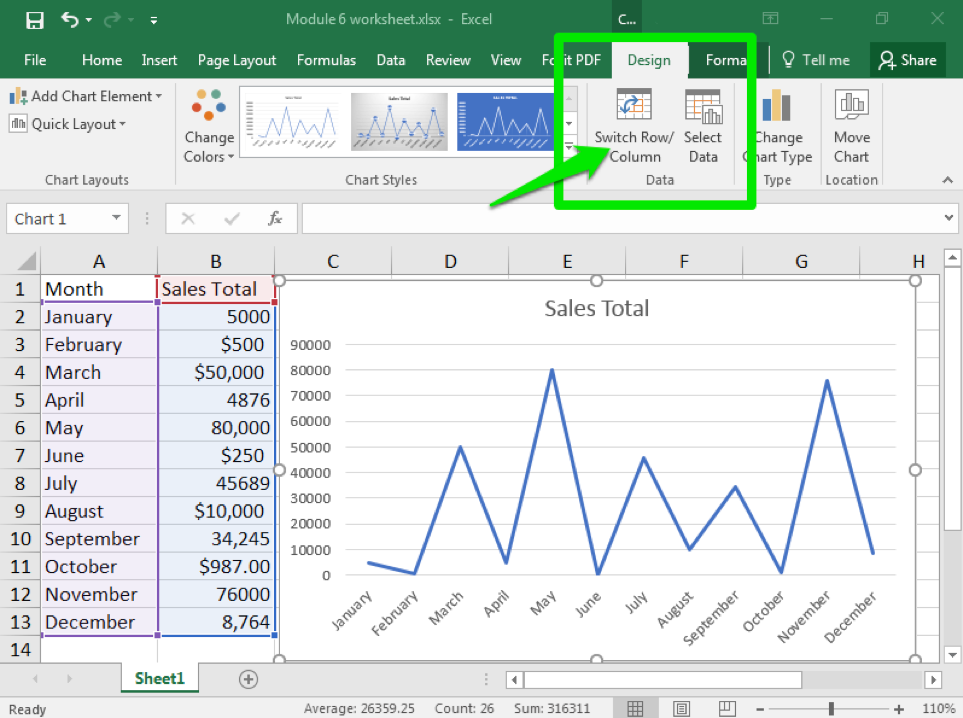
From this same window, you can also switch the data that is being charted. For example, you can switch which data from a row to a column or change which data is arranged on the x- or y-axis.
Practice Question
Candela Citations
CC licensed content, Original
- Chart Types. Authored by: Shelli Carter. Provided by: Lumen Learning. License: CC BY: Attribution


