Learning Outcomes
- Graph systems of equations
Graph a system of linear equations
There are multiple methods of solving systems of linear equations. For a system of linear equations in two variables, we can determine both the type of system and the solution by graphing the system of equations on the same set of axes.
We will practice graphing two equations on the same set of axes, and then we will explore the different considerations you need to make when graphing two linear inequalities on the same set of axes. The same techniques are used to graph a system of linear equations as you have used to graph single linear equations. We can use tables of values, slope and [latex]y[/latex]-intercept, or [latex]x[/latex]– and [latex]y[/latex]-intercepts to graph both lines on the same set of axes.
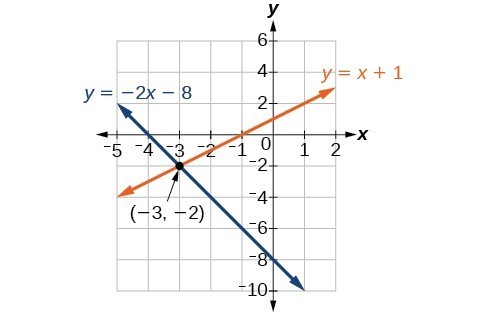
Example
Solve the following system of equations by graphing. Identify the type of system.
[latex]\begin{array}{c}2x+y=-8\\ x-y=-1\end{array}[/latex]
You can watch the video below for another example of how to solve a system of equations by first graphing the lines and then identifying the solution the system has.
Try It
In the following example, you will be given a system to graph that consists of two parallel lines.
Example
Graph the system [latex]\begin{array}{c}y=2x+1\\y=2x-3\end{array}[/latex] using the slopes and [latex]y[/latex]-intercepts of the lines.


In the next example, you will be given a system whose equations look different, but after graphing, turn out to be the same line.
Example
Graph the system [latex]\begin{array}{c}y=\frac{1}{2}x+2\\2y-x=4\end{array}[/latex] using the x – and y-intercepts.

As demonstrated by the examples above, graphing can be used if the system is inconsistent or dependent. In both cases, we can still graph the system to determine the type of system and solution. If the two lines are parallel, the system has no solution and is inconsistent. If the two lines are identical, the system has infinite solutions and is a dependent system.
The video below provides more examples of how to graph systems of linear equations.
Graphing a system of linear equations consists of choosing which graphing method you want to use and drawing the graphs of both equations on the same set of axes.
Candela Citations
- Revision and Adaptation. Provided by: Lumen Learning. License: CC BY: Attribution
- Graphing a System of Linear Equation. Authored by: James Sousa (Mathispower4u.com) for Lumen Learning. Located at: https://youtu.be/BBmB3rFZLXU. License: CC BY: Attribution
- Unit 14: Systems of Equations and Inequalities, from Developmental Math: An Open Program. Provided by: Monterey Institute of Technology and Education. Located at: http://nrocnetwork.org/resources/downloads/nroc-math-open-textbook-units-1-12-pdf-and-word-formats/. License: CC BY: Attribution
- Ex 1: Graph a System of Linear Inequalities Mathispower4u Mathispower4u. Authored by: James Sousa (Mathispower4u.com) for Lumen Learning. Located at: https://youtu.be/ACTxJv1h2_c. License: CC BY: Attribution
