Learning Outcomes
- Interpret graphs and solutions to systems of linear inequalities
In our first example we will show how to write and graph a system of linear inequalities that models the amount of sales needed to obtain a specific amount of money.
Example
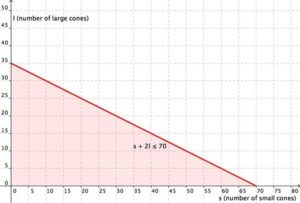
Cathy is selling ice cream cones at a school fundraiser. She is selling two sizes: small (which has [latex]1[/latex] scoop) and large (which has [latex]2[/latex] scoops). She knows that she can get a maximum of [latex]70[/latex] scoops of ice cream out of her supply. She charges [latex]$3[/latex] for a small cone and [latex]$5[/latex] for a large cone.
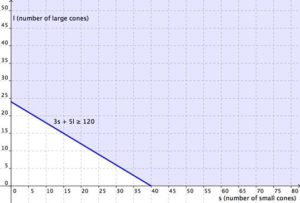
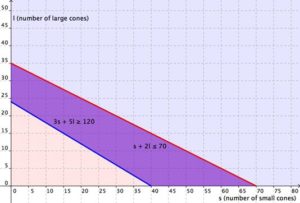
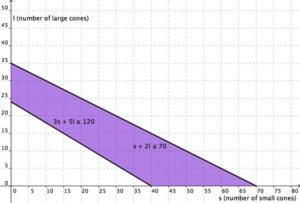
Cathy wants to earn at least [latex]$120[/latex] to give back to the school. Write and graph a system of inequalities that models this situation.
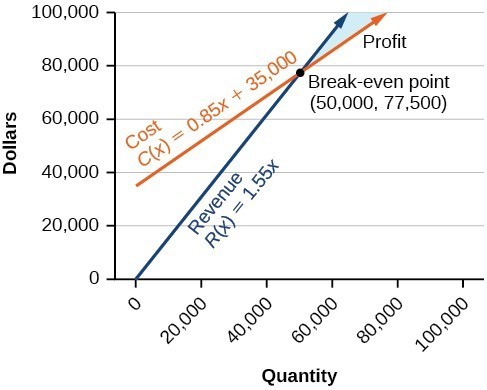
In a previous example for finding a solution to a system of linear equations, we introduced a manufacturer’s cost and revenue equations:
Cost: [latex]y=0.85x+35,000[/latex]
Revenue: [latex]y=1.55x[/latex]
[latex]x\ge0,y\ge0[/latex]
The cost equation is shown in blue in the graph below, and the revenue equation is graphed in orange. The point at which the two lines intersect is called the break-even point. We learned that this is the solution to the system of linear equations that cause the cost and revenue equations to equal each other. Note how the lines shown only represent where [latex]x\ge0, y\ge0[/latex]. It is easy to forget to include this part in the graph.
The shaded region to the right of the break-even point represents quantities where the company makes a profit. The region to the left represents quantities where the company suffers a loss.
In the next example, you will see how the information you learned about systems of linear inequalities can be applied to answering questions about cost and revenue.
Note how the blue shaded region between the cost and revenue equations is labeled profit. This is the “sweet spot” that the company wants to achieve where they produce enough bike frames at a minimal enough cost to make money. They do not want more money going out than coming in!
Example
Define the profit region for the bike manufacturing business using inequalities, given the system of linear equations:
Cost: [latex]y=0.85x+35,000[/latex]
Revenue: [latex]y=1.55x[/latex]
[latex]x\ge0, y\ge0[/latex]

In the following video, you will see an example of how to find the break-even point for a small sno-cone business.
Below is one more video example about solving an application using a system of linear inequalities.
We have seen that systems of linear equations and inequalities can help to define market behaviors that are very helpful to businesses. The intersection of cost and revenue equations gives the break-even point and also helps define the region where a company will make a profit.
Candela Citations
- System of Equations App: Break-Even Point. Authored by: James Sousa (Mathispower4u.com) for Lumen Learning. Located at: https://youtu.be/qey3FmE8saQ. License: CC BY: Attribution
- Revision and Adaptation. Provided by: Lumen Learning. License: CC BY: Attribution
- College Algebra. Authored by: Jay Abrams, et al.. Provided by: OpenStax. Located at: https://openstaxcollege.org/textbooks/college-algebra.. License: CC BY: Attribution
- Unit 14: Systems of Equations and Inequalities, from Developmental Math: An Open Program. Provided by: Monterey Institute of Technology and Education. Located at: http://nrocnetwork.org/dm-opentext. License: CC BY: Attribution
- Ex: Linear Inequality in Two Variables Application Problem (Phone Cost: Day and Night Minutes). Authored by: James Sousa (Mathispower4u.com) . Located at: https://youtu.be/gbHl6K-dJ8o. License: CC BY: Attribution
