Learning Outcomes
- Explain the law of demand
- Explain a demand curve
Watch It
Demand describes the amount of goods or services that consumers want to (and are able to) pay in order to purchase that good or service. Before learning more about the details of demand, watch this video to get a basic understanding about what it is and its importance to understanding economic behavior.
You can view the transcript for “Episode 11 – Demand” (opens in new window).
The law of demand states that, other things being equal:
- More of a good will be bought, the lower its price
- Less of a good will be bought, the higher its price
Ceteris paribus means “other things being equal.”
Demand for Goods and Services
 Economists use the term demand to refer to the amount of some good or service consumers are willing and able to purchase at each price. Demand is based on needs and wants—a consumer may be able to differentiate between a need and a want, but from an economist’s perspective, they are the same thing. Demand is also based on ability to pay. If you can’t pay for it, then you have no effective demand.
What a buyer pays for a unit of the specific good or service is called the price. The total number of units purchased at that price is called the quantity demanded. A rise in the price of a good or service almost always decreases the quantity of that good or service demanded. Conversely, a fall in price will increase the quantity demanded. When the price of a gallon of gasoline goes up, for example, people look for ways to reduce their consumption by combining several errands, commuting by carpool or mass transit, or taking weekend or vacation trips closer to home. Economists call this inverse relationship between price and quantity demanded the law of demand. The law of demand assumes that all other variables that affect demand are held constant.
An example from the market for gasoline can be shown in the form of a table or a graph. A table that shows the quantity demanded at each price, such as Table 1, is called a demand schedule. Price in this case is measured in dollars per gallon of gasoline. The quantity demanded is measured in millions of gallons over some time period (for example, per day or per year) and over some geographic area (like a state or a country).
| Price (per gallon) | Quantity Demanded (millions of gallons) |
|---|---|
| $1.00 | 800 |
| $1.20 | 700 |
| $1.40 | 600 |
| $1.60 | 550 |
| $1.80 | 500 |
| $2.00 | 460 |
| $2.20 | 420 |
A demand curve shows the relationship between price and quantity demanded on a graph like Figure 1, below, with quantity on the horizontal axis and the price per gallon on the vertical axis. Note that this is an exception to the normal rule in mathematics that the independent variable (X) goes on the horizontal axis and the dependent variable (Y) goes on the vertical. Economics is different from math! Note also that each point on the demand curve comes from one row in Table 1. For example, the uppermost point on the demand curve corresponds to the last row in Table 1, while the lowermost point corresponds to the first row.
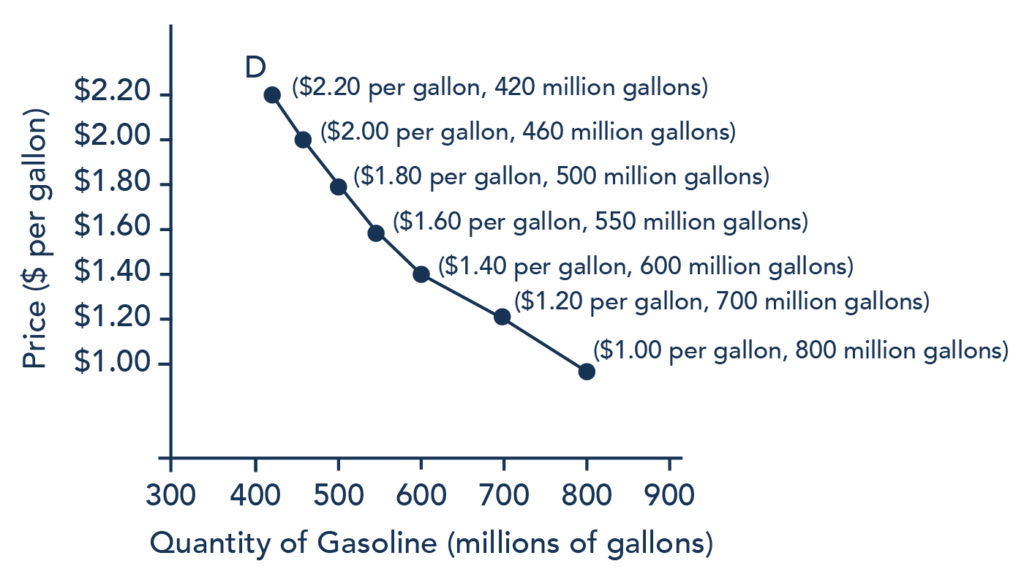
Figure 1. A Demand Curve for Gasoline (derived from the data in Table 1).
The demand schedule (Table 1) shows that as price rises, quantity demanded decreases, and vice versa. These points can then be graphed, and the line connecting them is the demand curve (shown by line D in the graph, above). The downward slope of the demand curve again illustrates the law of demand—the inverse relationship between prices and quantity demanded.
The demand schedule shown by Table 1 and the demand curve shown by the graph in Figure 1 are two ways of describing the same relationship between price and quantity demanded.
Demand curves look somewhat different for each product. They may appear relatively steep or flat, or they may be straight or curved. Nearly all demand curves share the fundamental similarity that they slope down from left to right. In this way, demand curves embody the law of demand: as the price increases, the quantity demanded decreases; and conversely, as the price decreases, the quantity demanded increases.
Practice Questions
Demand vs. Quantity Demanded
In economic terminology, demand is not the same as quantity demanded. When economists talk about demand, they mean the relationship between a range of prices and the quantities demanded at those prices, as illustrated by a demand curve or a demand schedule. When economists talk about quantity demanded, they mean only a certain point on the demand curve, or one quantity on the demand schedule. In short, demand refers to the curve, and quantity demanded refers to the (specific) point on the curve.
Change in Demand vs. Change in Quantity Demanded
It’s hard to overstate the importance of understanding the difference between shifts in curves and movements along curves. Remember, when we talk about changes in demand or supply, we do not mean the same thing as changes in quantity demanded or quantity supplied.
A change in demand refers to a shift in the entire demand curve, which is caused by a variety of factors (preferences, income, prices of substitutes and complements, expectations, population, etc.). In this case, the entire demand curve moves left or right.

Figure 2. Change in Demand. A change in demand means that the entire demand curve shifts either left or right. The initial demand curve D0 shifts to become either D1 or D2. This could be caused by a shift in tastes, changes in population, changes in income, prices of substitute or complement goods, or changes in future expectations.
A change in quantity demanded refers to a movement along the demand curve caused only by a change in price. In this case, the demand curve doesn’t move; rather, we move along the existing demand curve.

Figure 3. Change in Quantity Demanded. A change in the quantity demanded refers to movement along the existing demand curve, D0. This is a change in price caused by a shift in the supply curve.
Candela Citations
- Revision and adaptation. Provided by: Lumen Learning. License: CC BY: Attribution
- Principles of Microeconomics Chapter 3.1. Authored by: OpenStax College. Provided by: Rice University. Located at: http://cnx.org/contents/ea2f225e-6063-41ca-bcd8-36482e15ef65@10.31:24/Microeconomics. License: CC BY: Attribution. License Terms: Download for free at http://cnx.org/content/col11627/latest
- Presto. Authored by: michaelgoodin. Located at: https://www.flickr.com/photos/michaelgoodin/6395014081/. License: CC BY-NC-ND: Attribution-NonCommercial-NoDerivatives
- Episode 11: Demand. Authored by: Dr. Mary J. McGlasson. Located at: https://www.youtube.com/watch?v=uXlZIn6W7Ew&feature=youtu.be. License: CC BY-NC-ND: Attribution-NonCommercial-NoDerivatives
- Episode 12: Change in Demand vs Change in Quantity Demanded. Authored by: Dr. Mary J. McGlasson. Located at: https://youtu.be/aTSwcXJ700c. License: CC BY-NC-ND: Attribution-NonCommercial-NoDerivatives