Learning Outcomes
- Describe age categories of late adulthood
Defining Late Adulthood: Age or Quality of Life?

Figure 1. 82-year old bodybuilder Ernestine Shepherd is quoted saying, “You’re not getting old; you’re getting ready.”
We are considered in late adulthood from the time we reach our mid-sixties until death. Because we are living longer, late adulthood is getting longer. Whether we start counting at 65, as demographers may suggest, or later, there is a greater proportion of people alive in late adulthood than anytime in world history. A 10-year-old child today has a 50 percent chance of living to age 104. Some demographers have even speculated that the first person ever to live to be 150 is alive today.
About 15.2 percent of the U.S. population or 49.2 million Americans are 65 and older.[1] This number is expected to grow to 98.2 million by the year 2060, at which time people in this age group will comprise nearly one in four U.S. residents. Of this number, 19.7 million will be age 85 or older. Developmental changes vary considerably among this population, so it is further divided into categories of 65 plus, 85 plus, and centenarians for comparison by the census.[2]
Demographers use chronological age categories to classify individuals in late adulthood. Developmentalists, however, divide this population in to categories based on physical and psychosocial well-being, in order to describe one’s functional age. The “young old” are healthy and active. The “old old” experience some health problems and difficulty with daily living activities. The “oldest old” are frail and often in need of care. A 98 year old woman who still lives independently, has no major illnesses, and is able to take a daily walk would be considered as having a functional age of “young old”. Therefore, optimal aging refers to those who enjoy better health and social well-being than average.
Normal aging refers to those who seem to have the same health and social concerns as most of those in the population. However, there is still much being done to understand exactly what normal aging means. Impaired aging refers to those who experience poor health and dependence to a greater extent than would be considered normal. Aging successfully involves making adjustments as needed in order to continue living as independently and actively as possible. This is referred to as selective optimization with compensation. Selective Optimization With Compensation is a strategy for improving health and well being in older adults and a model for successful aging. It is recommended that seniors select and optimize their best abilities and most intact functions while compensating for declines and losses. This means, for example, that a person who can no longer drive, is able to find alternative transportation, or a person who is compensating for having less energy, learns how to reorganize the daily routine to avoid overexertion. Perhaps nurses and other allied health professionals working with this population will begin to focus more on helping patients remain independent by optimizing their best functions and abilities rather than on simply treating illnesses. Promoting health and independence are essential for successful aging.
Watch It: Aging Successfully
Systematic examination of old age is a new field inspired by the unprecedented number of people living longer. Developmental psychologists Paul and Margret Baltes have proposed a model of adaptive competence for the entire life span, but the emphasis here is on old age. Their model SOC (Selection, Optimization, and Compensation) is illustrated with engaging vignettes of people leading fulfilling lives, including writers Betty Friedan and Joan Erikson, and dancer Bud Mercer. Segments of the cognitive tests used by the Baltes in assessing the mental abilities of older people are shown. Although the video clip show below is old and dated, it remains an intellectually appealing video in which the Baltes discuss personality components that generally lead to positive aging experiences.
Try It
Age Categories
Senescence, or biological aging, is the gradual deterioration of functional characteristics.[3]

Figure 2. The word senescence, can be traced back to Latin senex, meaning “old.” Lots of other English words come from senex—senile, senior, senate, etc. The word senate to describe a legislative assembly dates back to ancient Rome, where the Senatus was originally a council of elders composed of the heads of patrician families. There’s also the much rarer senectitude, which, like senescence, refers to the state of being old (specifically, to the final stage of the normal life span).
The Young Old—65 to 74
These 18.3 million Americans tend to report greater health and social well-being than older adults. Having good or excellent health is reported by 41 percent of this age group (Center for Disease Control, 2004). Their lives are more similar to those of midlife adults than those who are 85 and older. This group is less likely to require long-term care, to be dependent or to be poor, and more likely to be married, working for pleasure rather than income, and living independently. About 65 percent of men and 50 percent of women between the ages of 65-69 continue to work full-time (He et al., 2005).
Physical activity tends to decrease with age, despite the dramatic health benefits enjoyed by those who exercise. People with more education and income are more likely to continue being physically active. And males are more likely to engage in physical activity than are females. The majority of the young-old continue to live independently. Only about 3 percent of those 65-74 need help with daily living skills as compared with about 22.9 percent of people over 85. (Another way to consider this is that 97 percent of people between 65-74 and 77 percent of people over 85 do not require assistance!) This age group is less likely to experience heart disease, cancer, or stroke than the old, but nearly as likely to experience depression (U.S. Census, 2005).
The Old Old—75 to 84
This age group is more likely to experience limitations on physical activity due to chronic disease such as arthritis, heart conditions, hypertension (especially for women), and hearing or visual impairments. Rates of death due to heart disease, cancer, and cerebral vascular disease are double that experienced by people 65-74. Poverty rates are 3 percent higher (12 percent) than for those between 65 and 74. However, the majority of these 12.9 million Americans live independently or with relatives. Widowhood is more common in this group-especially among women.
The Oldest Old—85 plus
The number of people 85 and older is 34 times greater than in 1900 and now includes 5.7 million Americans. This group is more likely to require long-term care and to be in nursing homes. However, of the 38.9 million American over 65, only 1.6 million require nursing home care. Sixty-eight percent live with relatives and 27 percent live alone (He et al., 2005; U. S. Census Bureau, 2011).
Figure 3. Kirk Douglas, actor and filmmaker, who lived to be a centenarian.
The Centenarians
Centenarians, or people aged 100 or older, are both rare and distinct from the rest of the older population. Although uncommon, the number of people living past age 100 is on the rise; between the year 2000 and 2014, then number of centenarians increased by over 43.6%, from 50,281 in 2000 to 72,197 in 2014.[4] In 2010, over half (62.5 percent) of the 53,364 centenarians were age 100 or 101.[5]
This number is expected to increase to 601,000 by the year 2050 (U. S. Census Bureau, 2011). The majority is between ages 100 and 104 and eighty percent are women. Out of almost 7 billion people on the planet, about 25 are over 110. Most live in Japan, a few live the in United States and three live in France (National Institutes of Health, 2006). These “super-Centenarians” have led varied lives and probably do not give us any single answers about living longer. Jeanne Clement smoked until she was 117. She lived to be 122. She also ate a diet rich in olive oil and rode a bicycle until she was 100. Her family had a history of longevity. Pitskhelauri (in Berger, 2005) suggests that moderate diet, continued work and activity, inclusion in family and community life, and exercise and relaxation are important ingredients for long life.
Blue Zones
Recent research on longevity reveals that people in some regions of the world live significantly longer than people elsewhere. Efforts to study the common factors between these areas and the people who live there is known as blue zone research. Blue zones are regions of the world where Dan Buettner claims people live much longer than average. The term first appeared in his November 2005 National Geographic magazine cover story, “The Secrets of a Long Life.” Buettner identified five regions as “Blue Zones”: Okinawa (Japan); Sardinia (Italy); Nicoya (Costa Rica); Icaria (Greece); and the Seventh-day Adventists in Loma Linda, California. He offers an explanation, based on data and first hand observations, for why these populations live healthier and longer lives than others.
The people inhabiting blue zones share common lifestyle characteristics that contribute to their longevity. The Venn diagram below highlights the following six shared characteristics among the people of Okinawa, Sardinia, and Loma Linda blue zones. Though not a lifestyle choice, they also live as isolated populations with a related gene pool.
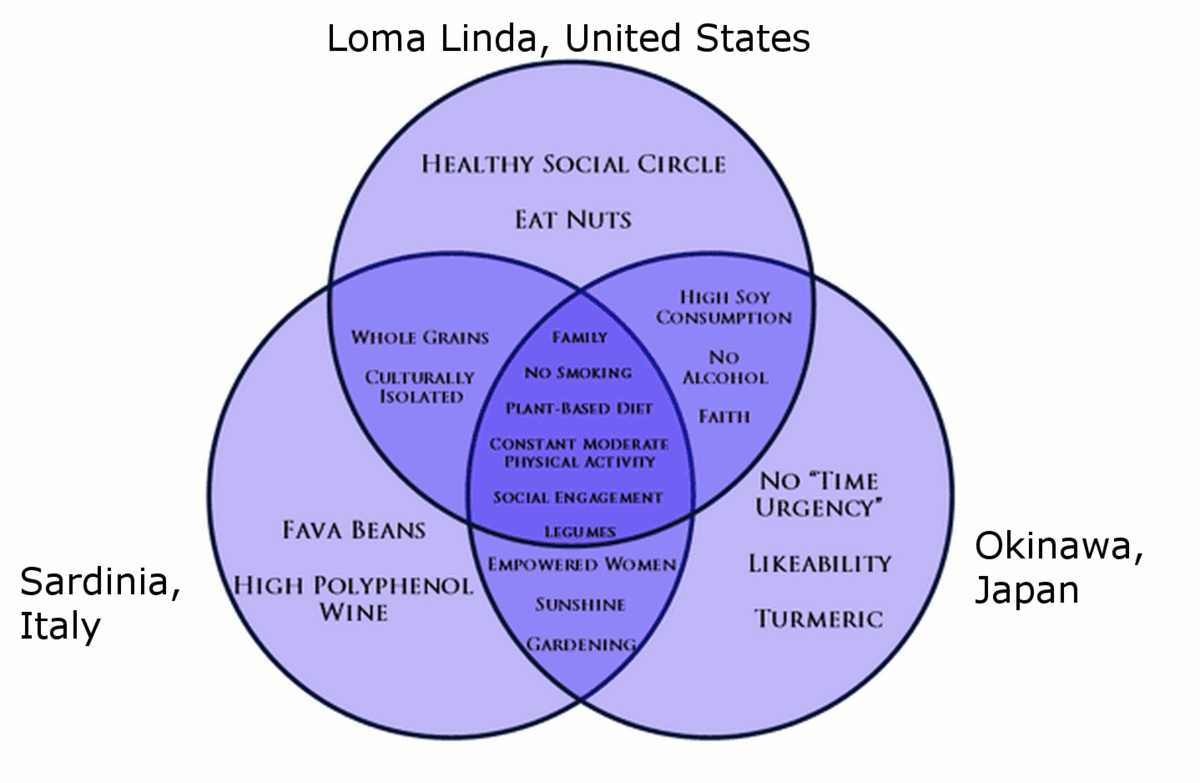
Figure 4. Blue zones share many common healthy habits contributing to longer lifespans.
- Family – put ahead of other concerns
- Less smoking
- Semi-vegetarianism – the majority of food consumed is derived from plants
- Constant moderate physical activity – an inseparable part of life
- Social engagement – people of all ages are socially active and integrated into their communities
- Legumes – commonly consumed
In his book, Buettner provides a list of nine lessons, covering the lifestyle of blue zones people:
- Moderate, regular physical activity.
- Life purpose.
- Stress reduction.
- Moderate caloric intake.
- Plant-based diet.
- Moderate alcohol intake, especially wine.
- Engagement in spirituality or religion.
- Engagement in family life.
- Engagement in social life.
Try It
Glossary
- blue zones:
- regions of the world where Dan Buettner claims people live much longer than average
- centenarians:
- people aged 100 or older
- Selective Optimization with Compensation (SOC):
- a strategy for improving health and well being in older adults and a model for successful aging
- senescence:
- biological aging and the gradual deterioration of functional abilities
Candela Citations
- Modification, adaptation, and original content. Authored by: Sonja Ann Miller for Lumen Learning. Provided by: Lumen Learning. License: CC BY: Attribution
- Review, modification, adaptation, and original content. Authored by: Daniel Dickman for Lumen Learning. Provided by: Lumen Learning. License: CC BY-SA: Attribution-ShareAlike
- Senescence description. Provided by: Wikipedia. Located at: https://en.wikipedia.org/wiki/Senescence. License: CC BY: Attribution
- Kirk Douglas. Provided by: Wikipedia. Located at: https://en.wikipedia.org/wiki/Kirk_Douglas#/media/File:KirkDouglasZubinMehtaMar11.jpg. License: CC BY-SA: Attribution-ShareAlike
- Psyc 200 Lifespan Psychology. Authored by: Laura Overstreet. Located at: http://opencourselibrary.org/econ-201/. License: CC BY: Attribution
- Blue Zones. Provided by: Wikipedia. Located at: https://en.wikipedia.org/wiki/Blue_Zone. License: CC BY-SA: Attribution-ShareAlike
- man on bench. Provided by: Pxhere. Located at: https://pxhere.com/en/photo/1559483. License: CC0: No Rights Reserved
- Ernestine Shepard. Located at: http://ernestineshepherd.net/?page_id=2. License: All Rights Reserved. License Terms: Fair Use
- Aging Successfully: The Psychological Aspects of Growing Old . Provided by: Davidson Films, Inc.. Located at: https://www.youtube.com/watch?v=g2JXyl-gek4&=&feature=youtu.be. License: Other. License Terms: Standard YouTube License
- US Census Bureau. (2018, April 10). The Nation's Older Population Is Still Growing, Census Bureau Reports. Retrieved from https://www.census.gov/newsroom/press-releases/2017/cb17-100.html ↵
- US Census Bureau. (2018, August 03). Newsroom. Retrieved from https://www.census.gov/newsroom/facts-for-features/2017/cb17-ff08.html ↵
- Senescence. (n.d.). Retrieved from https://www.merriam-webster.com/dictionary/senescence ↵
- Xu, Giaquan, M.C. (2016). Centers for Disease Control and Prevention.Mortality Among Centenarians in the United States, 2000─2014. https://www.cdc.gov/nchs/data/databriefs/db233.pdf. ↵
- US Census Bureau. (2018, August 03). Newsroom. Retrieved from https://www.census.gov/newsroom/facts-for-features/2017/cb17-ff08.html ↵