Click on the link to download the problem set for this module: Applications of Supply and Demand Problem Set.
Applications of Supply and Demand Problem Set[1]
- The graph below shows the supply and demand curves for burritos. Suppose that the government imposes a Price Ceiling equal to $5.
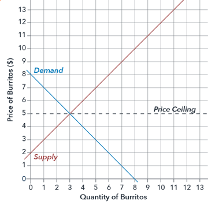
Will this result in a binding or non-binding price ceiling?
Use the following information to answer questions 2 through 7:
The graph below shows the supply and demand curves for soda.
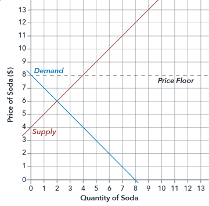
- First consider a situation without any government interventions and no price controls. In that case, what is the equilibrium quantity?
- What is the equilibrium price?
- Now suppose that the government imposes a Price Floor equal to $8. As a result of this new policy, what is the quantity demanded?
- What is the new quantity supplied?
- As a result of this Price Floor, is there shortage or surplus, or is the price control non-binding?
- What is the amount of the shortage or surplus?
Use the following information to answer questions 8 through 10:
The graph below shows the supply and demand curves for pizza rolls.
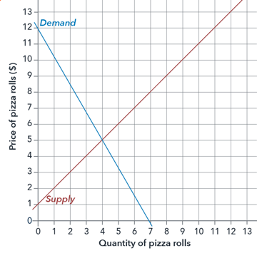
- What is the size of consumer surplus?
- What is the size of producer surplus?
- What is the size of social (total) surplus?
Use the following information to answer questions 11 through 14:
The graph below shows the supply and demand curves for beer. Suppose that the government imposes a Price Ceiling of 4.

- What is the size of consumer surplus?
- What is the size of producer surplus?
- What is the size of deadweight loss?
- What is the size of social (total) surplus?
Use the following information to answer questions 15 through 23:
Use the graph below to answer the following questions.

- What is the size of consumer surplus when there is no government price control?
- What is the size of producer surplus when there is no government price control?
- What is the size of social surplus when there is no government price control?
- What is the size of deadweight loss when there is no government price control?
- What is the size of consumer surplus when a price ceiling of $5 is imposed?
- What is the size of producer surplus when a price ceiling of $5 is imposed?
- What is the size of deadweight loss from a price ceiling of $5?
- What is the size of social surplus when a price ceiling of $5 is imposed?
- What is the difference between total surplus before and after price control is imposed? How does this number compare to the deadweight loss?
Use the following information to answer questions 24 through 32:
The graph below shows the supply and demand curves for beer.

- What is the size of consumer surplus when there is no government price control?
- What is the size of producer surplus when there is no government price control?
- What is the size of social surplus when there is no government price control? What is the size of deadweight loss when there is no government price control?
- What is the size of consumer surplus when Price Floor of $9 is imposed?
- What is the size of producer surplus when Price Floor of $9 is imposed?
- What is the size of deadweight loss from Price Floor of $9?
- What is the size of social surplus when Price Floor of $9 is imposed?
- What is the difference between total surplus before and after price control is imposed?
- How does this number compare to the DWL?
[1] This assignment by Lumen Learning is licensed under a Creative Commons Attribution 4.0 International License. You can access an alternative means to plotting points at https://www.desmos.com/calculator.
Candela Citations
CC licensed content, Original
- Assignment: Applications of Supply and Demand Problem Set. Provided by: Lumen Learning. License: CC BY: Attribution