Learning Outcomes
- Use intercepts to graph a line
- Use intercepts combined with a third point to graph a line
- Determine the most convenient way to graph a line given it’s equation
Graph a Line Using the Intercepts
To graph a linear equation by plotting points, you can use the intercepts as two of your three points. Find the two intercepts, and then a third point to ensure accuracy, and draw the line. This method is often the quickest way to graph a line.
example
Graph [latex]-x+2y=6[/latex] using intercepts.
Solution
First, find the [latex]x\text{-intercept}[/latex].
Let [latex]y=0[/latex],
[latex]\begin{array}{}\\ -x+2y=6\\ -x+2\left(0\right)=6\\ -x=6\\ x=-6\end{array}[/latex]
The [latex]x\text{-intercept}[/latex] is [latex]\left(-6,0\right)[/latex].
Now find the [latex]y\text{-intercept}[/latex].
Let [latex]x=0[/latex].
[latex]\begin{array}{}\\ -x+2y=6\\ -0+2y=6\\ \\ \\ 2y=6\\ y=3\end{array}[/latex]
The [latex]y\text{-intercept}[/latex] is [latex]\left(0,3\right)[/latex].
Find a third point.
We’ll use [latex]x=2[/latex],
[latex]\begin{array}{}\\ -x+2y=6\\ -2+2y=6\\ \\ \\ 2y=8\\ y=4\end{array}[/latex]
A third solution to the equation is [latex]\left(2,4\right)[/latex].
Summarize the three points in a table and then plot them on a graph.
| [latex]-x+2y=6[/latex] | ||
|---|---|---|
| x | y | (x,y) |
| [latex]-6[/latex] | [latex]0[/latex] | [latex]\left(-6,0\right)[/latex] |
| [latex]0[/latex] | [latex]3[/latex] | [latex]\left(0,3\right)[/latex] |
| [latex]2[/latex] | [latex]4[/latex] | [latex]\left(2,4\right)[/latex] |
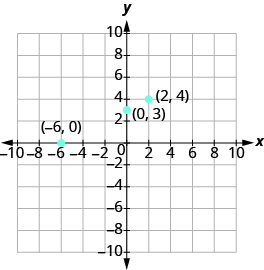
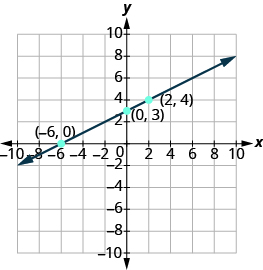
Do the points line up? Yes, so draw line through the points.
try it
Graph a line using the intercepts
- Find the [latex]x-[/latex] and [latex]\text{y-intercepts}[/latex] of the line.
- Let [latex]y=0[/latex] and solve for [latex]x[/latex]
- Let [latex]x=0[/latex] and solve for [latex]y[/latex].
- Find a third solution to the equation.
- Plot the three points and then check that they line up.
- Draw the line.
example
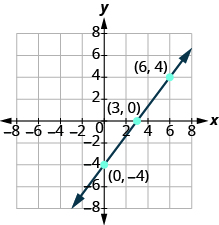
Graph [latex]4x - 3y=12[/latex] using intercepts.

try it
example
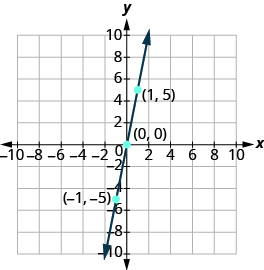
Graph [latex]y=5x[/latex] using the intercepts.


try it
In the following video we show another example of how to plot a line using the intercepts of the line.
Choosing the Most Convenient Way to Graph a Line Given an Equation
While we could graph any linear equation by plotting points, it may not always be the most convenient method. This table shows six of equations we’ve graphed in this chapter, and the methods we used to graph them.
| Equation | Method | |
|---|---|---|
| #1 | [latex]y=2x+1[/latex] | Plotting points |
| #2 | [latex]y=\Large\frac{1}{2}\normalsize x+3[/latex] | Plotting points |
| #3 | [latex]x=-7[/latex] | Vertical line |
| #4 | [latex]y=4[/latex] | Horizontal line |
| #5 | [latex]2x+y=6[/latex] | Intercepts |
| #6 | [latex]4x - 3y=12[/latex] | Intercepts |
What is it about the form of equation that can help us choose the most convenient method to graph its line?
Notice that in equations #1 and #2, y is isolated on one side of the equation, and its coefficient is 1. We found points by substituting values for x on the right side of the equation and then simplifying to get the corresponding y- values.
Equations #3 and #4 each have just one variable. Remember, in this kind of equation the value of that one variable is constant; it does not depend on the value of the other variable. Equations of this form have graphs that are vertical or horizontal lines.
In equations #5 and #6, both x and y are on the same side of the equation. These two equations are of the form [latex]Ax+By=C[/latex] . We substituted [latex]y=0[/latex] and [latex]x=0[/latex] to find the x- and y- intercepts, and then found a third point by choosing a value for x or y.
This leads to the following strategy for choosing the most convenient method to graph a line.
Choose the most convenient method to graph a line
- If the equation has only one variable. It is a vertical or horizontal line.
- [latex]x=a[/latex] is a vertical line passing through the [latex]x\text{-axis}[/latex] at [latex]a[/latex]
- [latex]y=b[/latex] is a horizontal line passing through the [latex]y\text{-axis}[/latex] at [latex]b[/latex].
- If [latex]y[/latex] is isolated on one side of the equation. Graph by plotting points.
- Choose any three values for [latex]x[/latex] and then solve for the corresponding [latex]y\text{-}[/latex] values.
- If the equation is of the form [latex]Ax+By=C[/latex], find the intercepts.
- Find the [latex]x\text{-}[/latex] and [latex]y\text{-}[/latex] intercepts and then a third point.
example
Identify the most convenient method to graph each line:
1. [latex]y=-3[/latex]
2. [latex]4x - 6y=12[/latex]
3. [latex]x=2[/latex]
4. [latex]y=\frac{2}{5}x - 1[/latex]
Solution
1. [latex]y=-3[/latex]
This equation has only one variable, [latex]y[/latex]. Its graph is a horizontal line crossing the [latex]y\text{-axis}[/latex] at [latex]-3[/latex].
2. [latex]4x - 6y=12[/latex]
This equation is of the form [latex]Ax+By=C[/latex]. Find the intercepts and one more point.
3. [latex]x=2[/latex]
There is only one variable, [latex]x[/latex]. The graph is a vertical line crossing the [latex]x\text{-axis}[/latex] at [latex]2[/latex].
4. [latex]y=\Large\frac{2}{5}\normalsize x - 1[/latex]
Since [latex]y[/latex] is isolated on the left side of the equation, it will be easiest to graph this line by plotting three points.
try it
Candela Citations
- Question ID 147001, 146998, 146999, 147002. Authored by: Lumen Learning. License: CC BY: Attribution
- Prealgebra. Provided by: OpenStax. License: CC BY: Attribution. License Terms: Download for free at http://cnx.org/contents/caa57dab-41c7-455e-bd6f-f443cda5519c@9.757