Learning Outcomes
- Find the mode of a set of numbers
The average is one number in a set of numbers that is somehow typical of the whole set of numbers. The mean and median are both often called the average. Yes, it can be confusing when the word average refers to two different numbers, the mean and the median! In fact, there is a third number that is also an average. This average is the mode. The mode of a set of numbers is the number that occurs the most. The frequency, is the number of times a number occurs. So the mode of a set of numbers is the number with the highest frequency.
Mode
The mode of a set of numbers is the number with the highest frequency.
Suppose Jolene kept track of the number of miles she ran since the start of the month, as shown in the calendar below.
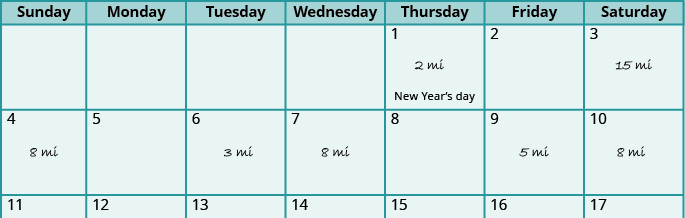
If we list the numbers in order it is easier to identify the one with the highest frequency.
[latex]2,3,5,8,8,8,15[/latex]
Jolene ran [latex]8[/latex] miles three times, and every other distance is listed only once. So the mode of the data is [latex]8[/latex] miles.
Identify the mode of a set of numbers.
- List the data values in numerical order.
- Count the number of times each value appears.
- The mode is the value with the highest frequency.
example
The ages of students in a college math class are listed below. Identify the mode.
[latex]18,18,18,18,19,19,19,20,20,20,20,20,20,20,21,21,22,22,22,22,22,23,24,24,25,29,30,40,44[/latex]
Solution
The ages are already listed in order. We will make a table of frequencies to help identify the age with the highest frequency.
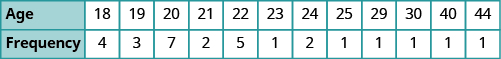
Now look for the highest frequency. The highest frequency is [latex]7[/latex], which corresponds to the age [latex]20[/latex]. So the mode of the ages in this class is [latex]20[/latex] years.
TRY IT
The number of sick days employees used last year: [latex]3,6,2,3,7,5,6,2,4,2[/latex]. Identify the mode.
The number of handbags owned by women in a book club: [latex]5,6,3,1,5,8,1,5,8,5[/latex]. Identify the mode.
example
The data lists the heights (in inches) of students in a statistics class. Identify the mode.
| [latex]56[/latex] | [latex]61[/latex] | [latex]63[/latex] | [latex]64[/latex] | [latex]65[/latex] | [latex]66[/latex] | [latex]67[/latex] | [latex]67[/latex] |
| [latex]60[/latex] | [latex]62[/latex] | [latex]63[/latex] | [latex]64[/latex] | [latex]65[/latex] | [latex]66[/latex] | [latex]67[/latex] | [latex]70[/latex] |
| [latex]60[/latex] | [latex]63[/latex] | [latex]63[/latex] | [latex]64[/latex] | [latex]66[/latex] | [latex]66[/latex] | [latex]67[/latex] | [latex]74[/latex] |
| [latex]61[/latex] | [latex]63[/latex] | [latex]64[/latex] | [latex]65[/latex] | [latex]66[/latex] | [latex]67[/latex] | [latex]67[/latex] |

TRY IT
The ages of the students in a statistics class are listed here: [latex]19[/latex] , [latex]20[/latex] , [latex]23[/latex] , [latex]23[/latex] , [latex]38[/latex] , [latex]21[/latex] , [latex]19[/latex] , [latex]21[/latex] , [latex]19[/latex] , [latex]21[/latex] , [latex]20[/latex] , [latex]43[/latex] , [latex]20[/latex] , [latex]23[/latex] , [latex]17[/latex] , [latex]21[/latex] , [latex]21[/latex] , [latex]20[/latex] , [latex]29[/latex] , [latex]18[/latex] , [latex]28[/latex] . What is the mode?
Students listed the number of members in their household as follows: [latex]6[/latex] , [latex]2[/latex] , [latex]5[/latex] , [latex]6[/latex] , [latex]3[/latex] , [latex]7[/latex] , [latex]5[/latex] , [latex]6[/latex] , [latex]5[/latex] , [latex]3[/latex] , [latex]4[/latex] , [latex]4[/latex] , [latex]5[/latex] , [latex]7[/latex] , [latex]6[/latex] , [latex]4[/latex] , [latex]5[/latex] , [latex]2[/latex] , [latex]1[/latex] , [latex]5[/latex] . What is the mode?
Some data sets do not have a mode because no value appears more than any other. And some data sets have more than one mode. In a given set, if two or more data values have the same highest frequency, we say they are all modes.
Watch the following video for another example of how to find the mode of a data set.
Candela Citations
- Ex: Find the Mode of a Data Set. Authored by: James Sousa (Mathispower4u.com). Located at: https://youtu.be/YhgXmO_FpHY. License: CC BY: Attribution
- Prealgebra. Provided by: OpenStax. License: CC BY: Attribution. License Terms: Download for free at http://cnx.org/contents/caa57dab-41c7-455e-bd6f-f443cda5519c@9.757