Learning Outcomes
- Locate an object on a map using coordinate directions
- Plot points on a rectangular coordinate system
- Identify the quadrant where a point is located on a rectangular coordinate system
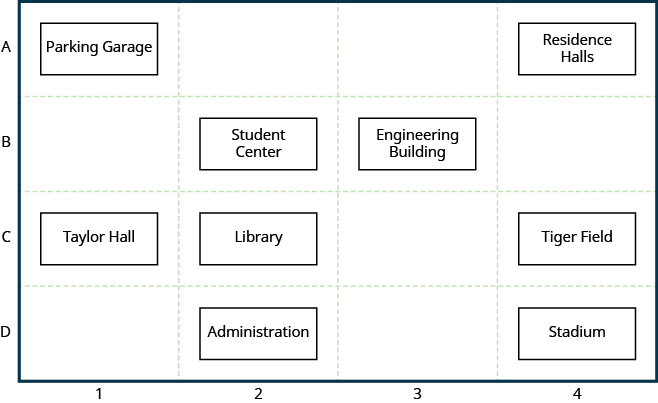
Many maps, such as the Campus Map shown below, use a grid system to identify locations. Do you see the numbers [latex]1,2,3[/latex], and [latex]4[/latex] across the top and bottom of the map and the letters A, B, C, and D along the sides? Every location on the map can be identified by a number and a letter.
For example, the Student Center is in section 2B. It is located in the grid section above the number [latex]2[/latex] and next to the letter B. In which grid section is the Stadium? The Stadium is in section 4D.
example
Use the map above.
- Find the grid section of the Residence Halls.
- What is located in grid section 4C?
Solution
- Read the number below the Residence Halls, [latex]4[/latex], and the letter to the side, A. So the Residence Halls are in grid section 4A.
- Find [latex]4[/latex] across the bottom of the map and C along the side. Look below the [latex]4[/latex] and next to the C. Tiger Field is in grid section 4C.
try it
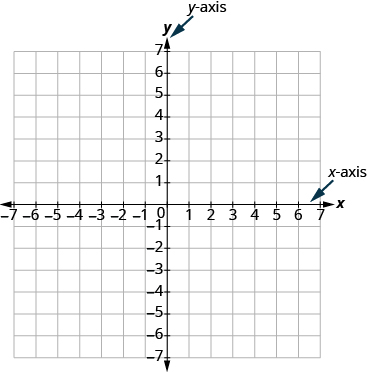
Just as maps use a grid system to identify locations, a grid system is used in algebra to show a relationship between two variables in a rectangular coordinate system. To create a rectangular coordinate system, start with a horizontal number line. Show both positive and negative numbers as you did before, using a convenient scale unit. This horizontal number line is called the x-axis.

Now, make a vertical number line passing through the [latex]x\text{-axis}[/latex] at [latex]0[/latex]. Put the positive numbers above [latex]0[/latex] and the negative numbers below [latex]0[/latex]. See the image below. This vertical line is called the y-axis.
Vertical grid lines pass through the integers marked on the [latex]x\text{-axis}[/latex]. Horizontal grid lines pass through the integers marked on the [latex]y\text{-axis}[/latex]. The resulting grid is the rectangular coordinate system.
The rectangular coordinate system is also called the [latex]x\text{-}y[/latex] plane, the coordinate plane, or the Cartesian coordinate system (since it was developed by a mathematician named René Descartes.)
The rectangular coordinate system
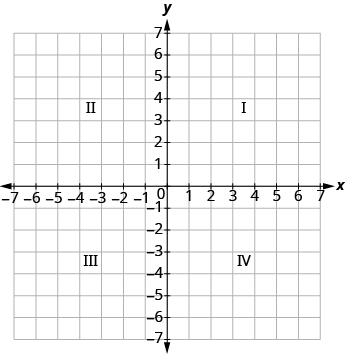
The [latex]x\text{-axis}[/latex] and the [latex]y\text{-axis}[/latex] form the rectangular coordinate system. These axes divide a plane into four areas, called quadrants. The quadrants are identified by Roman numerals, beginning on the upper right and proceeding counterclockwise. See the image below.
The four quadrants of the rectangular coordinate system
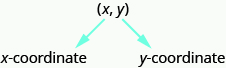
In the rectangular coordinate system, every point is represented by an ordered pair. The first number in the ordered pair is the x-coordinate of the point, and the second number is the y-coordinate of the point.
Ordered Pair
An ordered pair, [latex]\left(x,y\right)[/latex] gives the coordinates of a point in a rectangular coordinate system.
[latex]\begin{array}{c}\text{The first number is the }x\text{-coordinate}.\hfill \\ \text{The second number is the }y\text{-coordinate}.\hfill \end{array}[/latex]
So how do the coordinates of a point help you locate a point on the [latex]x\text{-}y[/latex] plane?
Let’s try locating the point [latex]\left(2,5\right)[/latex] . In this ordered pair, the [latex]x[/latex] -coordinate is [latex]2[/latex] and the [latex]y[/latex] -coordinate is [latex]5[/latex] .
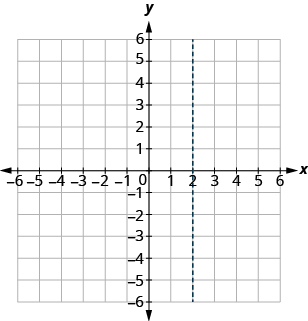
We start by locating the [latex]x[/latex] value, [latex]2[/latex], on the [latex]x\text{-axis.}[/latex] Then we lightly sketch a vertical line through [latex]x=2[/latex], as shown in the image below.
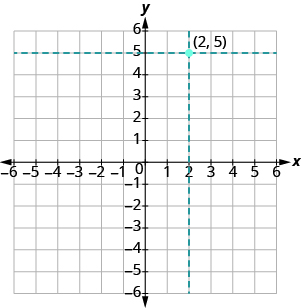
Now we locate the [latex]y[/latex] value, [latex]5[/latex], on the [latex]y[/latex] -axis and sketch a horizontal line through [latex]y=5[/latex] . The point where these two lines meet is the point with coordinates [latex]\left(2,5\right)[/latex]. We plot the point there, as shown in the image below.
example
Plot [latex]\left(1,3\right)[/latex] and [latex]\left(3,1\right)[/latex] in the same rectangular coordinate system.


try it
Exercises
Plot each point in the rectangular coordinate system and identify the quadrant in which the point is located:
1. [latex]\left(-1,3\right)[/latex]
2. [latex]\left(-3,-4\right)[/latex]
3. [latex]\left(2,-3\right)[/latex]
4. [latex]\left(3,{\Large\frac{5}{2}}\right)[/latex]

try it
example
How do the signs affect the location of the points?
Plot each point:
1. [latex]\left(-5,2\right)[/latex]
2. [latex]\left(-5,-2\right)[/latex]
3. [latex]\left(5,2\right)[/latex]
4. [latex]\left(5,-2\right)[/latex]

try it
You may have noticed some patterns as you graphed the points in the two previous examples.
For each point in Quadrant IV, what do you notice about the signs of the coordinates?
What about the signs of the coordinates of the points in the third quadrant? The second quadrant? The first quadrant?
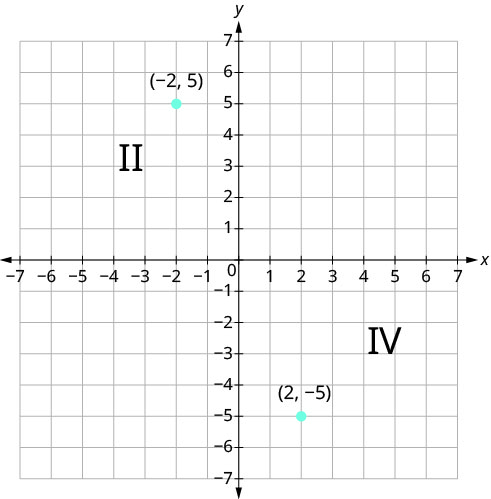
Can you tell just by looking at the coordinates in which quadrant the point [latex](−2, 5)[/latex] is located? In which quadrant is [latex](2, −5)[/latex] located?
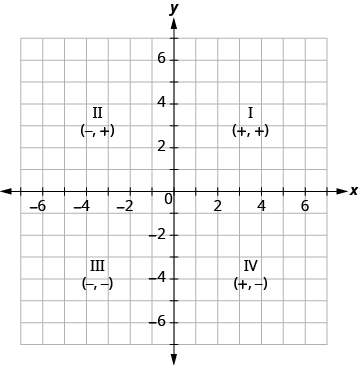
We can summarize sign patterns of the quadrants as follows. Also see the graph below.
| Quadrant I | Quadrant II | Quadrant III | Quadrant IV |
|---|---|---|---|
| (x,y) | (x,y) | (x,y) | (x,y) |
| (+,+) | (−,+) | (−,−) | (+,−) |
What if one coordinate is zero? Where is the point [latex]\left(0,4\right)[/latex] located? Where is the point [latex]\left(-2,0\right)[/latex] located? The point [latex]\left(0,4\right)[/latex] is on the [latex]y[/latex]-axis and the point [latex]\left(-2,0\right)[/latex] is on the [latex]x[/latex]-axis.
Points on the Axes
Points with a [latex]y\text{-coordinate}[/latex] equal to [latex]0[/latex] are on the [latex]x\text{-axis}[/latex], and have coordinates [latex]\left(a,0\right)[/latex].
Points with an [latex]x\text{-coordinate}[/latex] equal to [latex]0[/latex] are on the [latex]y\text{-axis}[/latex], and have coordinates [latex]\left(0,b\right)[/latex].
What is the ordered pair of the point where the axes cross? At that point both coordinates are zero, so its ordered pair is [latex]\left(0,0\right)[/latex] . The point has a special name. It is called the origin.
The Origin
The point [latex]\left(0,0\right)[/latex] is called the origin. It is the point where the x-axis and y-axis intersect.
ExAMPLE
Plot each point on a coordinate grid:
1. [latex]\left(0,5\right)[/latex]
2. [latex]\left(4,0\right)[/latex]
3. [latex]\left(-3,0\right)[/latex]
4. [latex]\left(0,0\right)[/latex]
5. [latex]\left(0,-1\right)[/latex]

TRY IT
In the following video, we show another example of how to plot several different points on the coordinate plane.
Candela Citations
- Question ID 146885, 146886, 146882, 146883. Authored by: Lumen Learning. License: CC BY: Attribution
- Ex: Plotting Points on the Coordinate Plane. Authored by: James Sousa (mathispower4u.com). Located at: https://youtu.be/7JMXi_FxA2o. License: CC BY: Attribution
- Prealgebra. Provided by: OpenStax. License: CC BY: Attribution. License Terms: Download for free at http://cnx.org/contents/caa57dab-41c7-455e-bd6f-f443cda5519c@9.757