Practice Makes Perfect
Plot Points on a Rectangular Coordinate System
In the following exercises, plot each point on a coordinate grid.
[latex]\left(3,2\right)[/latex]

[latex]\left(4,1\right)[/latex]
[latex]\left(1,5\right)[/latex]

[latex]\left(3,4\right)[/latex]
[latex]\left(4,1\right),\left(1,4\right)[/latex]

[latex]\left(3,2\right),\left(2,3\right)[/latex]
[latex]\left(3,4\right),\left(4,3\right)[/latex]

In the following exercises, plot each point on a coordinate grid and identify the quadrant in which the point is located.
ⓐ [latex]\left(-4,2\right)[/latex]
ⓑ [latex]\left(-1,-2\right)[/latex]
ⓒ [latex]\left(3,-5\right)[/latex]
ⓓ [latex]\left(2,\Large\frac{5}{2}\normalsize\right)[/latex]
ⓐ [latex]\left(-2,-3\right)[/latex]
ⓑ [latex]\left(3,-3\right)[/latex]
ⓒ [latex]\left(-4,1\right)[/latex]
ⓓ [latex]\left(1,\Large\frac{3}{2}\normalsize\right)[/latex]

ⓐ [latex]\left(-1,1\right)[/latex]
ⓑ [latex]\left(-2,-1\right)[/latex]
ⓒ [latex]\left(1,-4\right)[/latex]
ⓓ [latex]\left(3,\Large\frac{7}{2}\normalsize\right)[/latex]
ⓐ [latex]\left(3,-2\right)[/latex]
ⓑ [latex]\left(-3,2\right)[/latex]
ⓒ [latex]\left(-3,-2\right)[/latex]
ⓓ [latex]\left(3,2\right)[/latex]

ⓐ [latex]\left(4,-1\right)[/latex]
ⓑ [latex]\left(-4,1\right)[/latex]
ⓒ [latex]\left(-4,-1\right)[/latex]
ⓓ [latex]\left(4,1\right)[/latex]
ⓐ [latex]\left(-2,0\right)[/latex]
ⓑ [latex]\left(-3,0\right)[/latex]
ⓒ [latex]\left(0,4\right)[/latex]
ⓓ [latex]\left(0,2\right)[/latex]

Identify Points on a Graph
In the following exercises, name the ordered pair of each point shown.


Verify Solutions to an Equation in Two Variables
In the following exercises, determine which ordered pairs are solutions to the given equation.
[latex]2x+y=6[/latex]
ⓐ [latex]\left(1,4\right)[/latex]
ⓑ [latex]\left(3,0\right)[/latex]
ⓒ [latex]\left(2,3\right)[/latex]
ⓐ, ⓑ
[latex]x+3y=9[/latex]
- ⓐ [latex]\left(0,3\right)[/latex]
- ⓑ [latex]\left(6,1\right)[/latex]
- ⓒ [latex]\left(-3,-3\right)[/latex]
[latex]4x - 2y=8[/latex]
ⓐ [latex]\left(3,2\right)[/latex]
ⓑ [latex]\left(1,4\right)[/latex]
ⓒ [latex]\left(0,-4\right)[/latex]
ⓐ, ⓒ
[latex]3x - 2y=12[/latex]
ⓐ [latex]\left(4,0\right)[/latex]
ⓑ [latex]\left(2,-3\right)[/latex]
ⓒ [latex]\left(1,6\right)[/latex]
[latex]y=4x+3[/latex]
ⓐ [latex]\left(4,3\right)[/latex]
ⓑ [latex]\left(-1,-1\right)[/latex]
ⓒ [latex]\left(\Large\frac{1}{2}\normalsize,5\right)[/latex]
ⓑ, ⓒ
[latex]y=2x - 5[/latex]
ⓐ [latex]\left(0,-5\right)[/latex]
ⓑ [latex]\left(2,1\right)[/latex]
ⓒ [latex]\left(\Large\frac{1}{2}\normalsize ,-4\right)[/latex]
[latex]y=\Large\frac{1}{2}\normalsize x - 1[/latex]
ⓐ [latex]\left(2,0\right)[/latex]
ⓑ [latex]\left(-6,-4\right)[/latex]
ⓒ [latex]\left(-4,-1\right)[/latex]
ⓐ, ⓑ
[latex]y=\Large\frac{1}{3}\normalsize x+1[/latex]
ⓐ [latex]\left(-3,0\right)[/latex]
ⓑ [latex]\left(9,4\right)[/latex]
ⓒ [latex]\left(-6,-1\right)[/latex]
Find Solutions to Linear Equations in Two Variables
In the following exercises, complete the table to find solutions to each linear equation.
[latex]y=2x - 4[/latex]
| [latex]x[/latex] | [latex]y[/latex] | [latex]\left(x,y\right)[/latex] |
|---|---|---|
| [latex]-1[/latex] | ||
| [latex]0[/latex] | ||
| [latex]2[/latex] |
| [latex]x[/latex] | [latex]y[/latex] | [latex]\left(x,y\right)[/latex] |
|---|---|---|
| [latex]-1[/latex] | [latex]-6[/latex] | [latex]\left(-1,-6\right)[/latex] |
| [latex]0[/latex] | [latex]-4[/latex] | [latex]\left(0,-4\right)[/latex] |
| [latex]2[/latex] | [latex]0[/latex] | [latex]\left(2,0\right)[/latex] |
[latex]y=3x - 1[/latex]
| [latex]x[/latex] | [latex]y[/latex] | [latex]\left(x,y\right)[/latex] |
|---|---|---|
| [latex]-1[/latex] | ||
| [latex]0[/latex] | ||
| [latex]2[/latex] |
[latex]y=-x+5[/latex]
| [latex]x[/latex] | [latex]y[/latex] | [latex]\left(x,y\right)[/latex] |
|---|---|---|
| [latex]-2[/latex] | ||
| [latex]0[/latex] | ||
| [latex]3[/latex] |
| [latex]x[/latex] | [latex]y[/latex] | [latex]\left(x,y\right)[/latex] |
|---|---|---|
| [latex]-2[/latex] | [latex]7[/latex] | [latex]\left(-2,7\right)[/latex] |
| [latex]0[/latex] | [latex]5[/latex] | [latex]\left(0,5\right)[/latex] |
| [latex]3[/latex] | [latex]2[/latex] | [latex]\left(3,2\right)[/latex] |
[latex]y=\Large\frac{1}{3}\normalsize x+1[/latex]
| [latex]x[/latex] | [latex]y[/latex] | [latex]\left(x,y\right)[/latex] |
|---|---|---|
| [latex]0[/latex] | ||
| [latex]3[/latex] | ||
| [latex]6[/latex] |
[latex]y=-\Large\frac{3}{2}\normalsize x - 2[/latex]
| [latex]x[/latex] | [latex]y[/latex] | [latex]\left(x,y\right)[/latex] |
|---|---|---|
| [latex]-2[/latex] | ||
| [latex]0[/latex] | ||
| [latex]2[/latex] |
| [latex]x[/latex] | [latex]y[/latex] | [latex]\left(x,y\right)[/latex] |
|---|---|---|
| [latex]-2[/latex] | [latex]1[/latex] | [latex]\left(-2,1\right)[/latex] |
| [latex]0[/latex] | [latex]-2[/latex] | [latex]\left(0,-2\right)[/latex] |
| [latex]2[/latex] | [latex]-5[/latex] | [latex]\left(2,-5\right)[/latex] |
[latex]x+2y=8[/latex]
| [latex]x[/latex] | [latex]y[/latex] | [latex]\left(x,y\right)[/latex] |
|---|---|---|
| [latex]0[/latex] | ||
| [latex]4[/latex] | ||
| [latex]0[/latex] |
Everyday Math
Weight of a baby Mackenzie recorded her baby’s weight every two months. The baby’s age, in months, and weight, in pounds, are listed in the table, and shown as an ordered pair in the third column.
ⓐ Plot the points on a coordinate grid.
| [latex]\text{Age}[/latex] | [latex]\text{Weight}[/latex] | [latex]\left(x,y\right)[/latex] |
| [latex]0[/latex] | [latex]7[/latex] | [latex]\left(0,7\right)[/latex] |
| [latex]2[/latex] | [latex]11[/latex] | [latex]\left(2,11\right)[/latex] |
| [latex]4[/latex] | [latex]15[/latex] | [latex]\left(4,15\right)[/latex] |
| [latex]6[/latex] | [latex]16[/latex] | [latex]\left(6,16\right)[/latex] |
| [latex]8[/latex] | [latex]19[/latex] | [latex]\left(8,19\right)[/latex] |
| [latex]10[/latex] | [latex]20[/latex] | [latex]\left(10,20\right)[/latex] |
| [latex]12[/latex] | [latex]21[/latex] | [latex]\left(12,21\right)[/latex] |
ⓑ Why is only Quadrant I needed?
ⓐ

ⓑ Age and weight are only positive.
Weight of a child Latresha recorded her son’s height and weight every year. His height, in inches, and weight, in pounds, are listed in the table, and shown as an ordered pair in the third column.
ⓐ Plot the points on a coordinate grid.
| [latex]\begin{array}{c}\text{Height}\hfill \\ x\hfill \end{array}[/latex] | [latex]\begin{array}{c}\text{Weight}\hfill \\ y\hfill \end{array}[/latex] | [latex]\begin{array}{}\\ \left(x,y\right)\hfill \end{array}[/latex] |
| [latex]28[/latex] | [latex]22[/latex] | [latex]\left(28,22\right)[/latex] |
| [latex]31[/latex] | [latex]27[/latex] | [latex]\left(31,27\right)[/latex] |
| [latex]33[/latex] | [latex]33[/latex] | [latex]\left(33,33\right)[/latex] |
| [latex]37[/latex] | [latex]35[/latex] | [latex]\left(37,35\right)[/latex] |
| [latex]40[/latex] | [latex]41[/latex] | [latex]\left(40,41\right)[/latex] |
| [latex]42[/latex] | [latex]45[/latex] | [latex]\left(42,45\right)[/latex] |
ⓑ Why is only Quadrant I needed?
Writing Exercises
Have you ever used a map with a rectangular coordinate system? Describe the map and how you used it.
Answers may vary.
How do you determine if an ordered pair is a solution to a given equation?
Self Check
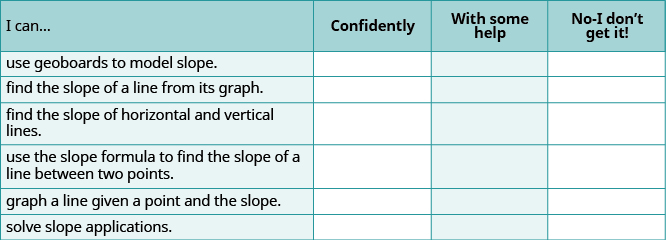
ⓐ After completing the exercises, use this checklist to evaluate your mastery of the objectives of this section.

ⓑ If most of your checks were:
…confidently. Congratulations! You have achieved the objectives in this section. Reflect on the study skills you used so that you can continue to use them. What did you do to become confident of your ability to do these things? Be specific.
…with some help. This must be addressed quickly because topics you do not master become potholes in your road to success. In math, every topic builds upon previous work. It is important to make sure you have a strong foundation before you move on. Who can you ask for help? Your fellow classmates and instructor are good resources. Is there a place on campus where math tutors are available? Can your study skills be improved?
…no—I don’t get it! This is a warning sign and you must not ignore it. You should get help right away or you will quickly be overwhelmed. See your instructor as soon as you can to discuss your situation. Together
Practice Makes Perfect
Identify the Intercepts on a Graph
In the following exercises, find the [latex]x\text{-}[/latex] and [latex]y\text{-}[/latex] intercepts.

(3,0),(0,3)


(5,0),(0,−5)


(−2,0),(0,−2)


(−1,0),(0,1)


(0,0)

Find the [latex]x[/latex] and [latex]y[/latex] Intercepts from an Equation of a Line
In the following exercises, find the intercepts.
[latex]x+y=4[/latex]
(4,0),(0,4)
[latex]x+y=3[/latex]
[latex]x+y=-2[/latex]
(−2,0),(0,−2)
[latex]x+y=-5[/latex]
[latex]x-y=5[/latex]
(5,0),(0,−5)
[latex]x-y=1[/latex]
[latex]x-y=-3[/latex]
(−3,0),(0,3)
[latex]x-y=-4[/latex]
[latex]x+2y=8[/latex]
(8,0),(0,4)
[latex]x+2y=10[/latex]
[latex]3x+y=6[/latex]
(2,0),(0,6)
[latex]3x+y=9[/latex]
[latex]x - 3y=12[/latex]
(12,0),(0,−4)
[latex]x - 2y=8[/latex]
[latex]4x-y=8[/latex]
(2,0),(0,−8)
[latex]5x-y=5[/latex]
[latex]2x+5y=10[/latex]
(5,0),(0,2)
[latex]2x+3y=6[/latex]
[latex]3x - 2y=12[/latex]
(4,0),(0,−6)
[latex]3x - 5y=30[/latex]
[latex]y=\Large\frac{1}{3}\normalsize x - 1[/latex]
(3,0),(0,−1)
[latex]y=\Large\frac{1}{4}\normalsize x - 1[/latex]
[latex]y=\Large\frac{1}{5}\normalsize x+2[/latex]
(−10,0),(0,2)
[latex]y=\Large\frac{1}{3}\normalsize x+4[/latex]
[latex]y=3x[/latex]
(0,0)
[latex]y=-2x[/latex]
[latex]y=-4x[/latex]
(0,0)
[latex]y=5x[/latex]
Graph a Line Using the Intercepts
In the following exercises, graph using the intercepts.
[latex]-x+5y=10[/latex]

[latex]-x+4y=8[/latex]
[latex]x+2y=4[/latex]

[latex]x+2y=6[/latex]
[latex]x+y=2[/latex]

[latex]x+y=5[/latex]
[latex]x+y=-3[/latex]

[latex]x+y=-1[/latex]
[latex]x-y=1[/latex]

[latex]x-y=2[/latex]
[latex]x-y=-4[/latex]

[latex]x-y=-3[/latex]
[latex]4x+y=4[/latex]

[latex]3x+y=3[/latex]
[latex]3x-y=-6[/latex]

[latex]2x-y=-8[/latex]
[latex]2x+4y=12[/latex]

[latex]3x+2y=12[/latex]
[latex]3x - 2y=6[/latex]

[latex]5x - 2y=10[/latex]
[latex]2x - 5y=-20[/latex]

[latex]3x - 4y=-12[/latex]
[latex]y=-2x[/latex]

[latex]y=-4x[/latex]
[latex]y=x[/latex]

[latex]y=3x[/latex]
Choose the Most Convenient Method to Graph a Line
In the following exercises, identify the most convenient method to graph each line.
[latex]x=2[/latex]
vertical line
[latex]y=4[/latex]
[latex]y=5[/latex]
horizontal line
[latex]x=-3[/latex]
[latex]y=-3x+4[/latex]
plotting points
[latex]y=-5x+2[/latex]
[latex]x-y=5[/latex]
intercepts
[latex]x-y=1[/latex]
[latex]y=\Large\frac{2}{3}\normalsize x - 1[/latex]
plotting points
[latex]y=\Large\frac{4}{5}\normalsize x - 3[/latex]
[latex]y=-3[/latex]
horizontal line
[latex]y=-1[/latex]
[latex]3x - 2y=-12[/latex]
intercepts
[latex]2x - 5y=-10[/latex]
[latex]y=-\Large\frac{1}{4}\normalsize x+3[/latex]
plotting points
[latex]y=-\Large\frac{1}{3}\normalsize x+5[/latex]
Everyday Math
Road trip Damien is driving from Chicago to Denver, a distance of [latex]1,000[/latex] miles. The [latex]x\text{-axis}[/latex] on the graph below shows the time in hours since Damien left Chicago. The [latex]y\text{-axis}[/latex] represents the distance he has left to drive.

ⓐ Find the [latex]x\text{-}[/latex] and [latex]y\text{-}[/latex] intercepts
ⓑ Explain what the [latex]x\text{-}[/latex] and [latex]y\text{-}[/latex] intercepts mean for Damien.
ⓐ (0,1,000),(15,0). ⓑ At (0,1,000) he left Chicago 0 hours ago and has 1,000 miles left to drive. At (15,0) he left Chicago 15 hours ago and has 0 miles left to drive.
Road trip Ozzie filled up the gas tank of his truck and went on a road trip. The [latex]x\text{-axis}[/latex] on the graph shows the number of miles Ozzie drove since filling up. The [latex]y\text{-axis}[/latex] represents the number of gallons of gas in the truck’s gas tank.

ⓐ Find the [latex]x\text{-}[/latex] and [latex]y\text{-}[/latex] intercepts.
ⓑ Explain what the [latex]x\text{-}[/latex] and [latex]y\text{-}[/latex] intercepts mean for Ozzie.
Writing Exercises
How do you find the [latex]x\text{-intercept}[/latex] of the graph of [latex]3x - 2y=6?[/latex]
Answers will vary.
How do you find the [latex]y\text{-intercept}[/latex] of the graph of [latex]5x-y=10?[/latex]
Do you prefer to graph the equation [latex]4x+y=-4[/latex] by plotting points or intercepts? Why?
Answers will vary.
Do you prefer to graph the equation [latex]y=\Large\frac{2}{3}\normalsize x - 2[/latex] by plotting points or intercepts? Why?
Self Check
ⓐ After completing the exercises, use this checklist to evaluate your mastery of the objectives of this section.

ⓑ What does this checklist tell you about your mastery of this section? What steps will you take to improve?
Practice Makes Perfect
Use Geoboards to Model Slope – CODE THESE in OHM
In the following exercises, find the slope modeled on each geoboard.

[latex]\Large\frac{1}{4}[/latex]


[latex]-\Large\frac{3}{2}[/latex]

In the following exercises, model each slope. Draw a picture to show your results.
[latex]\Large\frac{2}{3}[/latex]

[latex]\Large\frac{3}{4}[/latex]
[latex]\Large\frac{1}{4}[/latex]

[latex]\Large\frac{4}{3}[/latex]
[latex]-\Large\frac{1}{2}[/latex]

[latex]-\Large\frac{3}{4}[/latex]
[latex]-\Large\frac{2}{3}[/latex]

[latex]-\Large\frac{3}{2}[/latex]
Find the Slope of a Line from its Graph
In the following exercises, find the slope of each line shown.

[latex]\Large\frac{2}{5}[/latex]


[latex]\Large\frac{5}{4}[/latex]


[latex]-\Large\frac{1}{3}[/latex]


[latex]-\Large\frac{3}{4}[/latex]


[latex]\Large\frac{3}{4}[/latex]


[latex]-\Large\frac{5}{2}[/latex]


[latex]-\Large\frac{2}{3}[/latex]


[latex]\Large\frac{1}{4}[/latex]

Find the Slope of Horizontal and Vertical Lines
In the following exercises, find the slope of each line.
[latex]y=3[/latex]
0
[latex]y=1[/latex]
[latex]x=4[/latex]
undefined
[latex]x=2[/latex]
[latex]y=-2[/latex]
0
[latex]y=-3[/latex]
[latex]x=-5[/latex]
undefined
[latex]x=-4[/latex]
Use the Slope Formula to find the Slope of a Line between Two Points
In the following exercises, use the slope formula to find the slope of the line between each pair of points.
[latex]\left(1,4\right),\left(3,9\right)[/latex]
[latex]\Large\frac{5}{2}[/latex]
[latex]\left(2,3\right),\left(5,7\right)[/latex]
[latex]\left(0,3\right),\left(4,6\right)[/latex]
[latex]\Large\frac{3}{4}[/latex]
[latex]\left(0,1\right),\left(5,4\right)[/latex]
[latex]\left(2,5\right),\left(4,0\right)[/latex]
[latex]-\Large\frac{5}{2}[/latex]
[latex]\left(3,6\right),\left(8,0\right)[/latex]
[latex]\left(-3,3\right),\left(2,-5\right)[/latex]
[latex]-\Large\frac{8}{5}[/latex]
[latex]\left(-2,4\right),\left(3,-1\right)[/latex]
[latex]\left(-1,-2\right),\left(2,5\right)[/latex]
[latex]\Large\frac{7}{3}[/latex]
[latex]\left(-2,-1\right),\left(6,5\right)[/latex]
[latex]\left(4,-5\right),\left(1,-2\right)[/latex]
−1
[latex]\left(3,-6\right),\left(2,-2\right)[/latex]
Graph a Line Given a Point and the Slope
In the following exercises, graph the line given a point and the slope.
[latex]\left(1,-2\right);m=\Large\frac{3}{4}[/latex]

[latex]\left(1,-1\right);m=\Large\frac{1}{2}[/latex]
[latex]\left(2,5\right);m=-\Large\frac{1}{3}[/latex]

[latex]\left(1,4\right);m=-\Large\frac{1}{2}[/latex]
[latex]\left(-3,4\right);m=-\Large\frac{3}{2}[/latex]

[latex]\left(-2,5\right);m=-\Large\frac{5}{4}[/latex]
[latex]\left(-1,-4\right);m=\Large\frac{4}{3}[/latex]

[latex]\left(-3,-5\right);m=\Large\frac{3}{2}[/latex]
[latex]\left(0,3\right);m=-\Large\frac{2}{5}[/latex]

[latex]\left(0,5\right);m=-\Large\frac{4}{3}[/latex]
[latex]\left(-2,0\right);m=\Large\frac{3}{4}[/latex]

[latex]\left(-1,0\right);m=\Large\frac{1}{5}[/latex]
[latex]\left(-3,3\right);m=2[/latex]

[latex]\left(-4,2\right);m=4[/latex]
[latex]\left(1,5\right);m=-3[/latex]

[latex]\left(2,3\right);m=-1[/latex]
Solve Slope Applications
In the following exercises, solve these slope applications.
Slope of a roof A fairly easy way to determine the slope is to take a [latex]\text{12-inch}[/latex] level and set it on one end on the roof surface. Then take a tape measure or ruler, and measure from the other end of the level down to the roof surface. You can use these measurements to calculate the slope of the roof. What is the slope of the roof in this picture?

[latex]\Large\frac{1}{3}[/latex]
What is the slope of the roof shown?

Road grade A local road has a grade of [latex]\text{6%}[/latex]. The grade of a road is its slope expressed as a percent.
- ⓐ Find the slope of the road as a fraction and then simplify the fraction.
- ⓑ What rise and run would reflect this slope or grade?
ⓐ [latex]\Large\frac{3}{50}[/latex] ⓑ [latex]\text{rise}=3;\text{run}=50[/latex]
Highway grade A local road rises [latex]2[/latex] feet for every [latex]50[/latex] feet of highway.
- ⓐ What is the slope of the highway?
- ⓑ The grade of a highway is its slope expressed as a percent. What is the grade of this highway?
Everyday Math
Wheelchair ramp The rules for wheelchair ramps require a maximum [latex]1[/latex] inch rise for a [latex]12[/latex] inch run.
- ⓐ How long must the ramp be to accommodate a [latex]\text{24-inch}[/latex] rise to the door?
- ⓑ Draw a model of this ramp.
ⓐ 288 inches (24 feet)
ⓑ Models will vary.
Wheelchair ramp A [latex]\text{1-inch}[/latex] rise for a [latex]\text{16-inch}[/latex] run makes it easier for the wheelchair rider to ascend the ramp.
- ⓐ How long must the ramp be to easily accommodate a [latex]\text{24-inch}[/latex] rise to the door?
- ⓑ Draw a model of this ramp.
Writing Exercises
What does the sign of the slope tell you about a line?
Answers will vary.
How does the graph of a line with slope [latex]m=\Large\frac{1}{2}[/latex] differ from the graph of a line with slope [latex]m=2?[/latex]
Why is the slope of a vertical line undefined?
Answers will vary.
Explain how you can graph a line given a point and its slope.
Self Check
ⓐ After completing the exercises, use this checklist to evaluate your mastery of the objectives of this section.
ⓑ On a scale of 1–10, how would you rate your mastery of this section in light of your responses on the checklist? How can you improve this?
Chapter Review Exercises
Use the Rectangular Coordinate System
Plot Points in a Rectangular Coordinate System
In the following exercises, plot each point in a rectangular coordinate system.
[latex]\left(1,3\right),\left(3,1\right)[/latex]

[latex]\left(2,5\right),\left(5,2\right)[/latex]
In the following exercises, plot each point in a rectangular coordinate system and identify the quadrant in which the point is located.
- ⓐ [latex]\left(-1,-5\right)[/latex]
- ⓑ [latex]\left(-3,4\right)[/latex]
- ⓒ [latex]\left(2,-3\right)[/latex]
- ⓓ [latex]\left(1,\Large\frac{5}{2}\normalsize\right)[/latex]
ⓐ III
ⓑ II
ⓒ IV
ⓐ I
- ⓐ [latex]\left(3,-2\right)[/latex]
- ⓑ [latex]\left(-4,-1\right)[/latex]
- ⓒ [latex]\left(-5,4\right)[/latex]
- ⓓ [latex]\left(2,\Large\frac{10}{3}\normalsize\right)[/latex]
Identify Points on a Graph
In the following exercises, name the ordered pair of each point shown in the rectangular coordinate system.

ⓐ (5,3)
ⓑ (2,−1)
ⓒ (−3,−2)
ⓓ (−1,4)


ⓐ (2,0)
ⓑ (0,−5)
ⓒ (−4,0)
ⓓ (0,3)

Verify Solutions to an Equation in Two Variables
In the following exercises, find the ordered pairs that are solutions to the given equation.
[latex]5x+y=10[/latex]
- ⓐ [latex]\left(5,1\right)[/latex]
- ⓑ [latex]\left(2,0\right)[/latex]
- ⓒ [latex]\left(4,-10\right)[/latex]
ⓑ,ⓒ
[latex]y=6x - 2[/latex]
- ⓐ [latex]\left(1,4\right)[/latex]
- ⓑ [latex]\left(\Large\frac{1}{3}\normalsize ,0\right)[/latex]
- ⓒ [latex]\left(6,-2\right)[/latex]
Complete a Table of Solutions to a Linear Equation in Two Variables
In the following exercises, complete the table to find solutions to each linear equation.
[latex]y=4x - 1[/latex]
| [latex]x[/latex] | [latex]y[/latex] | [latex]\left(x,y\right)[/latex] |
|---|---|---|
| [latex]0[/latex] | ||
| [latex]1[/latex] | ||
| [latex]-2[/latex] |
| [latex]x[/latex] | [latex]y[/latex] | [latex]\left(x,y\right)[/latex] |
|---|---|---|
| [latex]0[/latex] | [latex]-1[/latex] | [latex]\left(0,-1\right)[/latex] |
| [latex]1[/latex] | [latex]3[/latex] | [latex]\left(1,3\right)[/latex] |
| [latex]-2[/latex] | [latex]-9[/latex] | [latex]\left(-2,-9\right)[/latex] |
[latex]y=-\Large\frac{1}{2}\normalsize x+3[/latex]
| [latex]x[/latex] | [latex]y[/latex] | [latex]\left(x,y\right)[/latex] |
|---|---|---|
| [latex]0[/latex] | ||
| [latex]1[/latex] | ||
| [latex]-2[/latex] |
[latex]x+2y=5[/latex]
| [latex]x[/latex] | [latex]y[/latex] | [latex]\left(x,y\right)[/latex] |
|---|---|---|
| [latex]0[/latex] | ||
| [latex]1[/latex] | ||
| [latex]-1[/latex] |
| [latex]x[/latex] | [latex]y[/latex] | [latex]\left(x,y\right)[/latex] |
|---|---|---|
| [latex]5[/latex] | [latex]0[/latex] | [latex]\left(5,0\right)[/latex] |
| [latex]1[/latex] | [latex]2[/latex] | [latex]\left(1,2\right)[/latex] |
| [latex]-1[/latex] | [latex]3[/latex] | [latex]\left(-1,3\right)[/latex] |
[latex]3x - 2y=6[/latex]
| [latex]x[/latex] | [latex]y[/latex] | [latex]\left(x,y\right)[/latex] |
|---|---|---|
| [latex]0[/latex] | ||
| [latex]0[/latex] | ||
| [latex]-2[/latex] |
Find Solutions to a Linear Equation in Two Variables
In the following exercises, find three solutions to each linear equation.
[latex]x+y=3[/latex]
Answers will vary.
[latex]x+y=-4[/latex]
[latex]y=3x+1[/latex]
Answers will vary.
[latex]y=-x - 1[/latex]
Graphing Linear Equations
Recognize the Relation Between the Solutions of an Equation and its Graph
In the following exercises, for each ordered pair, decide
ⓐ if the ordered pair is a solution to the equation.
ⓑ if the point is on the line.
[latex]y=-x+4[/latex]
- ⓐ [latex]\left(0,4\right)[/latex]
- ⓑ [latex]\left(-1,3\right)[/latex]
- ⓒ [latex]\left(2,2\right)[/latex]
- ⓓ [latex]\left(-2,6\right)[/latex]

ⓐ yes ⓑ no ⓒ yes ⓓ yes
ⓐ yes ⓑ no ⓒ yes ⓓ yes
[latex]y=\Large\frac{2}{3}\normalsize x - 1[/latex]
- ⓐ [latex]\left(0,-1\right)[/latex]
- ⓑ [latex]\left(3,1\right)[/latex]
- ⓒ [latex]\left(-3,-3\right)[/latex]
- ⓓ [latex]\left(6,4\right)[/latex]

Graph a Linear Equation by Plotting Points
In the following exercises, graph by plotting points.
[latex]y=4x - 3[/latex]

[latex]y=-3x[/latex]
[latex]2x+y=7[/latex]

Graph Vertical and Horizontal lines
In the following exercises, graph the vertical or horizontal lines.
[latex]y=-2[/latex]
[latex]x=3[/latex]

Graphing with Intercepts
Identify the Intercepts on a Graph
In the following exercises, find the [latex]x\text{-}[/latex] and [latex]y\text{-intercepts}[/latex].


(0,3) (3,0)
Find the Intercepts from an Equation of a Line
In the following exercises, find the intercepts.
[latex]x+y=5[/latex]
[latex]x-y=-1[/latex]
(−1,0) (0,1)
[latex]y=\Large\frac{3}{4}\normalsize x - 12[/latex]
[latex]y=3x[/latex]
(0,0)
Graph a Line Using the Intercepts
In the following exercises, graph using the intercepts.
[latex]-x+3y=3[/latex]
[latex]x+y=-2[/latex]

Choose the Most Convenient Method to Graph a Line
In the following exercises, identify the most convenient method to graph each line.
[latex]x=5[/latex]
[latex]y=-3[/latex]
horizontal line
[latex]2x+y=5[/latex]
[latex]x-y=2[/latex]
intercepts
[latex]y=\Large\frac{1}{2}\normalsize x+2[/latex]
[latex]y=\Large\frac{3}{4}\normalsize x - 1[/latex]
plotting points
Understand Slope of a Line
Use Geoboards to Model Slope
In the following exercises, find the slope modeled on each geoboard.


[latex]\Large\frac{4}{3}[/latex]


[latex]-\Large\frac{2}{3}[/latex]
In the following exercises, model each slope. Draw a picture to show your results.
[latex]\Large\frac{1}{3}[/latex]
[latex]\Large\frac{3}{2}[/latex]

[latex]-\Large\frac{2}{3}[/latex]
[latex]-\Large\frac{1}{2}[/latex]

Find the Slope of a Line from its Graph
In the following exercises, find the slope of each line shown.


1


[latex]-\Large\frac{1}{2}[/latex]
Find the Slope of Horizontal and Vertical Lines
In the following exercises, find the slope of each line.
[latex]y=2[/latex]
[latex]x=5[/latex]
undefined
[latex]x=-3[/latex]
[latex]y=-1[/latex]
0
Use the Slope Formula to find the Slope of a Line between Two Points
In the following exercises, use the slope formula to find the slope of the line between each pair of points.
[latex]\left(2,1\right),\left(4,5\right)[/latex]
[latex]\left(-1,-1\right),\left(0,-5\right)[/latex]
−4
[latex]\left(3,5\right),\left(4,-1\right)[/latex]
[latex]\left(-5,-2\right),\left(3,2\right)[/latex]
[latex]\Large\frac{1}{2}[/latex]
Graph a Line Given a Point and the Slope
In the following exercises, graph the line given a point and the slope.
[latex]\left(2,-2\right);m=\Large\frac{5}{2}[/latex]
[latex]\left(-3,4\right);m=-\Large\frac{1}{3}[/latex]

Solve Slope Applications
In the following exercise, solve the slope application.
A roof has rise [latex]10[/latex] feet and run [latex]15[/latex] feet. What is its slope?
Chapter Practice Test
Plot and label these points:
- ⓐ [latex]\left(2,5\right)[/latex]
- ⓑ [latex]\left(-1,-3\right)[/latex]
- ⓒ [latex]\left(-4,0\right)[/latex]
- ⓓ [latex]\left(3,-5\right)[/latex]
- ⓔ [latex]\left(-2,1\right)[/latex]

Name the ordered pair for each point shown.

Find the [latex]x\text{-intercept}[/latex] and [latex]y\text{-intercept}[/latex] on the line shown.

(4,0), (0,−2)
Find the [latex]x\text{-intercept}[/latex] and [latex]y\text{-intercept}[/latex] of the equation [latex]3x-y=6[/latex].
Is [latex]\left(1,3\right)[/latex] a solution to the equation [latex]x+4y=12?[/latex] How do you know?
no; 1 + 4 · 3 ≠ 12
Complete the table to find four solutions to the equation [latex]y=-x+1[/latex].
| [latex]x[/latex] | [latex]y[/latex] | [latex]\left(x,y\right)[/latex] |
| [latex]0[/latex] | ||
| [latex]1[/latex] | ||
| [latex]3[/latex] | ||
| [latex]-2[/latex] |
Complete the table to find three solutions to the equation [latex]4x+y=8[/latex]
| [latex]x[/latex] | [latex]y[/latex] | [latex]\left(x,y\right)[/latex] |
| [latex]0[/latex] | ||
| [latex]0[/latex] | ||
| [latex]3[/latex] |
| [latex]x[/latex] | [latex]y[/latex] | [latex]\left(x,y\right)[/latex] |
| [latex]0[/latex] | [latex]8[/latex] | [latex]\left(0,8\right)[/latex] |
| [latex]2[/latex] | [latex]0[/latex] | [latex]\left(2,0\right)[/latex] |
| [latex]3[/latex] | [latex]-4[/latex] | [latex]\left(3,-4\right)[/latex] |
In the following exercises, find three solutions to each equation and then graph each line.
[latex]y=-3x[/latex]
[latex]2x+3y=-6[/latex]

In the following exercises, find the slope of each line.


[latex]-\Large\frac{5}{2}[/latex]
Use the slope formula to find the slope of the line between [latex]\left(0,-4\right)[/latex] and [latex]\left(5,2\right)[/latex].
Find the slope of the line [latex]y=2[/latex].
0
Graph the line passing through [latex]\left(1,1\right)[/latex] with slope [latex]m=\Large\frac{3}{2}[/latex].
A bicycle route climbs [latex]20[/latex] feet for [latex]1,000[/latex] feet of horizontal distance. What is the slope of the route?
[latex]\Large\frac{1}{50}[/latex]
Candela Citations
- Prealgebra. Provided by: OpenStax. License: CC BY: Attribution. License Terms: Download for free at http://cnx.org/contents/caa57dab-41c7-455e-bd6f-f443cda5519c@9.757