Learning Objectives
Recognize how statistics are used (or misused) to tell a story.
Mark Twain once said, “There are lies, damned lies, and statistics.”[1] In a book named after Twain’s quote, Joel Best writes:
Some statistics are born bad—they aren’t much good from the start, because they are based on nothing more than guesses or dubious data. Other statistics mutate; they become bad after being mangled. Either way, bad statistics are potentially important: they can be used to stir up public outrage or fear; they can distort our understanding of our world; and they can lead us to make poor policy choices.[2]
Whenever you present statistics, it is important to examine them with a careful and critical eye. Statistics can tell a powerful story, but bad statistics can mislead your audience, weaken your argument, and damage your credibility. Below are some of the most common ways in which statistics are misused or misunderstood.
Common Misunderstandings of Statistics
False causality
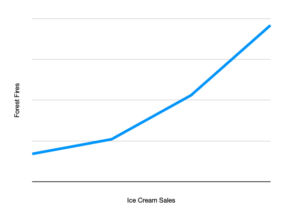
It would appear that higher ice cream sales lead to more forest fires. Is it time to ban ice cream?
A common misunderstanding when using statistics is correlation versus causation. Correlation does not equal causation, meaning that just because two variables are related, one variable does not necessarily cause the other variable to occur. For example, consider a data set that indicates that there is a relationship between ice cream purchases versus forest fires. The incorrect conclusion would be to say that the increase in ice cream consumption leads to more forest fires or vice versa. Therefore, when using statistics in public speaking, a speaker should always be sure that they are presenting accurate information when discussing two variables that may be related. Statistics can be used persuasively in all manners of arguments and public speaking scenarios—the key is understanding and interpreting the given data and molding that interpretation towards a convincing statement.
Discarding unfavorable observations
All a company has to do to promote a neutral (useless) product is to find or conduct, for example, 40 studies with a confidence level of 95%. If the product is really useless, the company would on average produce one study showing the product was beneficial, one study showing it was harmful, and 38 inconclusive studies (38 is 95% of 40). This tactic becomes more effective the more studies there are available.
Ignoring important features
The case of ice cream versus forest fires illustrates the problem with ignoring important features of the dataset—in this case, the variable of weather, which is important both for purchases of ice cream and more forest fires. Robert Sapolsky offers a fascinating historical example of the consequences of ignoring important variables: in the 18th and 19th centuries, scientists learned about the human body by dissecting cadavers. However, since these cadavers were taken entirely from impoverished populations (due to inequalities in how the rich and poor were treated after death), they had mostly died of chronic illnesses such as tuberculosis and malnutrition. Because the chronic stress of poverty and disease leads to swelling and shrinking of various glands in the body, scientists’ understanding of “normal” gland size was highly skewed deep into the 20th century, leading to rampant misdiagnoses and unnecessary treatments.[3]
Bad surveys (Loaded Questions)
The answers to surveys can often be manipulated by wording the question in such a way as to induce a prevalence towards a certain answer from the respondent. For example, in polling support for a war, the questions:
- Do you support the attempt by the U.S. to bring freedom and democracy to other places in the world?
- Do you support the unprovoked military action by the USA?
will likely result in data skewed in different directions, although they are both polling about the support for the war. A better way of wording the question could be, “Do you support the current U.S. military action abroad?” A still more nearly neutral way to put that question is “What is your view about the current U.S. military action abroad?” The point should be that the person being asked has no way of guessing from the wording what the questioner might want to hear.
Overgeneralization and Biased Samples

A recent survey showed that 98% of Americans favor candy over broccoli.
Overgeneralization is a fallacy occurring when a statistic about a particular population is asserted to hold among members of a group for which the original population is not a representative sample. Unrepresentative samples, or biased samples, can occur when the means used to conduct the survey fail to get an accurate representation of the overall population. For instance, consider a political poll collected through calls to landline phones instead of cell phones. As young people are more likely than other demographic groups to lack a conventional landline phone, a telephone poll that exclusively surveys responders of calls to landline phones may under-sample the views of young people, if no other measures are taken to account for this skewing of the sampling.
The “Identifiable Victim Effect”
The “identifiable victim effect” refers to a phenomenon observed by behavioral scientists that people tend to be more willing to help a single identifiable victim—that is, a person with a name, a face, and a story—than a group of “statistical victims.”[4] Both charitable organizations and politicians know this effect well; in eliciting money for a cause or support for a policy, they are likely to tell the story of one person affected by the situation, rather than just quoting statistics about the extent of the problem. There’s nothing wrong with the identifiable victim effect per se—after all, humans are hard-wired to respond empathetically to other humans in need, and that’s a good thing. However, the identifiable victim effect can be used strategically to counteract or override statistical evidence, in which case it should be measured against the evidence of the data. For instance, opponents of raising the estate tax might tell the story of a farming family who lost their farm due to taxes after the death of the original owner. While the story may be true, it is also worth noting that only about 0.07 percent of estates will pay any estate tax.[5]
To watch: Lilit Tarverdyan, “The Consequences of Misleading statistics”
In this video, Lilit Tarverdyan, a student at the American University of Armenia, shares the story of “escaping death” after performing the terrifying act of getting water from a vending machine. After all, she says, vending machines are four times deadlier than shark attacks worldwide.
You can view the transcript for “What are the consequences of misleading statistics? | Lilit Tarverdyan | TEDxAUA” here (opens in new window).
Misleading Graphs and Graphics
Graphs and graphics can simplify large data sets and make an argument more compelling and memorable. However, they can also distort the real significance of the data through the manipulation of scale and context or the omission of key data points. Make sure to look carefully at any graphs or graphics you might include in your presentation!
Deeper dive: How to Spot a Misleading Graph
In this short video, Lea Gaslowitz talks about how graphs can be misleading.
You can view the transcript for “How to spot a misleading graph – Lea Gaslowitz” here (opens in new window).
Candela Citations
- Misuse of statistics. Authored by: Wikipedia Contributors. Provided by: Wikipedia. Located at: https://en.wikipedia.org/wiki/Misuse_of_statistics. License: CC BY-SA: Attribution-ShareAlike
- Common Misunderstandings of Statistics. Authored by: Boundless. Provided by: Lumen Learning. Located at: https://courses.lumenlearning.com/sanjacinto-publicspeakingprinciples/chapter/using-statistics/. License: CC BY-SA: Attribution-ShareAlike
- What are the consequences of misleading statistics? | Lilit Tarverdyan | TEDxAUA. Provided by: TEDx Talks. Located at: https://youtu.be/ylEx_Xf63No. License: Other. License Terms: Standard YouTube License
- How to spot a misleading graph - Lea Gaslowitz. Provided by: TED-Ed. Located at: https://youtu.be/E91bGT9BjYk. License: Other. License Terms: Standard YouTube License
- Twain attributes this quote to Benjamin Disraeli. Twain, Mark, and Leary, Sheila. Mark Twain's Own Autobiography: The Chapters from the North American Review. University of Wisconsin Press, 2010, 185 ↵
- Best, Joel. Damned Lies and Statistics: Untangling Numbers from the Media, Politicians, and Activists. University of California Press, 2012, 5. ↵
- Sapolsky, Robert M. "Anecdotal Evidence: Poverty's Remains." The Sciences 31.5 (1991): 8–10. ↵
- Jenni, Karen E., and George Loewenstein. “Explaining the ‘Identifiable Victim Effect.’” Journal of Risk and Uncertainty, vol. 14, no. 3, 1997, pp. 235–257. JSTOR, www.jstor.org/stable/41760854. ↵
- https://www.taxpolicycenter.org/briefing-book/how-many-people-pay-estate-tax ↵