Why learn about growth models?
The following essay is adapted from blog posts on emergent math by Geoff Krall.
Can You Predict How Many Followers @charliesheen Has Right Now?
Sometime on March 1, 2011, Charlie Sheen joined twitter at the suggestion of Piers Morgan, who is apparently some type of person. By the time I was alerted of the existence of a @charliesheen twitter feed, it was 4:04 PM Mountain Standard Time. Sheen had yet to tweet, but already had somehow amassed over 100,000 followers. He hadn’t even put up an avatar of himself yet (and somehow the account was “verified”).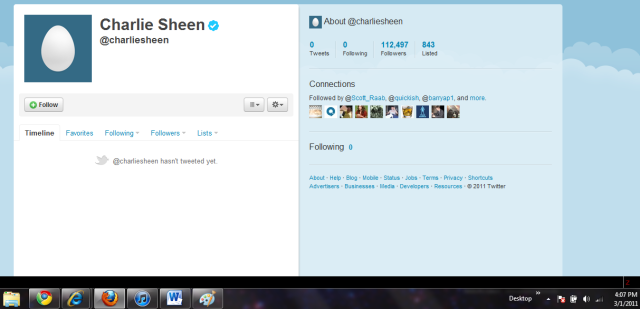
What happened over the next several hours was nothing short of amazing. All you had to do was wait a few seconds or minutes and hit “refresh,” and just watch the number of followers climb.
I did this for about 50 minutes and collected data along the way.
| Time on March 1, 2011 | # of Followers |
|---|---|
| 4:04 PM | 109,099 |
| 4:07 PM | 112,497 |
| 4:09 PM | 116,143 |
| 4:12 PM | 120,195 |
| 4:14 PM | 122,901 |
| 4:18 PM | 127,643 |
| 4:21 PM | 129,793 |
| 4:24 PM | 133,357 |
| 4:29 PM | 140,215 |
| 4:32 PM | 144,103 |
| 4:38 PM | 149,528 |
| 4:44 PM | 153,848 |
Later that night, I refreshed every half-hour or so and watched the number climbing steadily. At this point, he had made his first tweet.

| Time on March 1, 2011 | # of Followers |
|---|---|
| 6:21 PM | 261,894 |
| 6:24 PM | 275,638 |
| 6:49 PM | 302,077 |
| 7:13 PM | 324,595 |
| 7:38 PM | 348,955 |
| 8:45 PM | 429,904 |
Eventually I had to go to bed. So I did. And as soon as I woke up the next morning I went back to check Charlie Sheen’s number of twitter followers.
Now I’d be checking every hour or so. Recorded here.
| Time on March 2, 2011 | # of Followers |
|---|---|
| 6:45 AM | 729,703 |
| 8:51 AM | 799,008 |
| 9:36 AM | 820,538 |
| 10:23 AM | 841,940 |
| 11:16 AM | 865,972 |
| 12:43 PM | 902,291 |
| 1:47 PM | 926,557 |
| 3:09 PM | 957,259 |
The last datum I recorded was at 3:09 MST, at which point @charliesheen had 957,259 followers. So in less than 24 hours, Charlie Sheen had gained 800,000 followers on twitter.
I have two questions for you:
- At what time March, 1, did Charlie Sheen join twitter? and,
- How many followers does he have right now?
To answer, I’ll break this up into a few different time pieces. Here’s the plot of Charlie Sheen’s followers as I have them, only for 3/1/2011, the day he joined twitter.
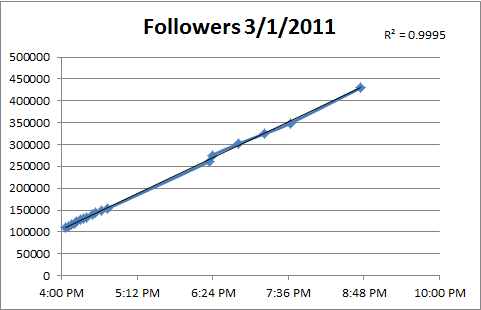
Not only is that a linear fit, it’s very linear (R-squared of 0.9995). I’m also shocked at how straight that line is. That is, there are not spikes of activity. I would have thought that in the evening, when everyone’s sitting in front of their TVs with their iPad 2’s there would be a marked increase in @charliesheen twitter followers.
Now let’s look at the same graph, but with all of Day 2 (3/2/2011) data included.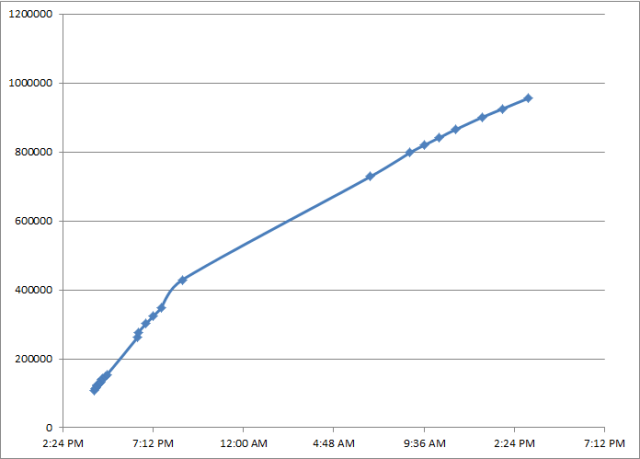
Unfortunately, I didn’t check Sheen’s twitter followers in the middle of the night, but it appears to have leveled off slightly going into Day 2 of the twitter account.
Now, I’m not 100% sure when the twitter feed account went live – in fact, that was one of the questions I asked last time – but I do have this: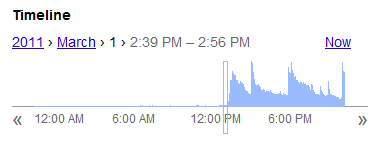
This is the Google realtime search feature. I would assume there’s a strong correlation between the Google realtime searches for “@charliesheen” and the activation of the twitter account. So it looks like the account may have gone active sometime in the mid-afternoon of 3/1/2011. Let’s call it 3:00 PM.
I took a couple of additional data points in the next couple of days, which leads me here:
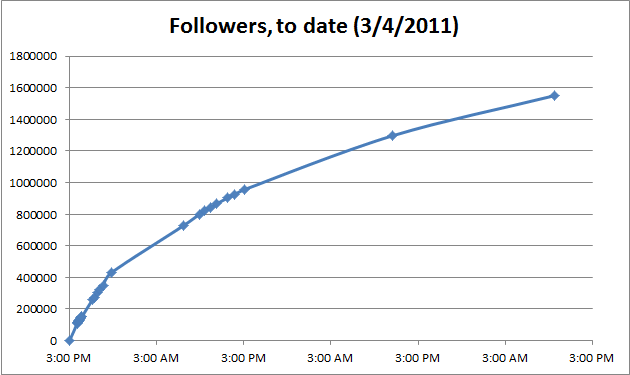
While still climbing steadily, the curve is nowhere near as steep as it was on Day 1, which is probably to be expected.
Hey, I bet the slope of the line over time would be interesting. And that would give us a clue as to where this thing is headed. Let’s break it up into (Change-in-followers per minute) vs. (time).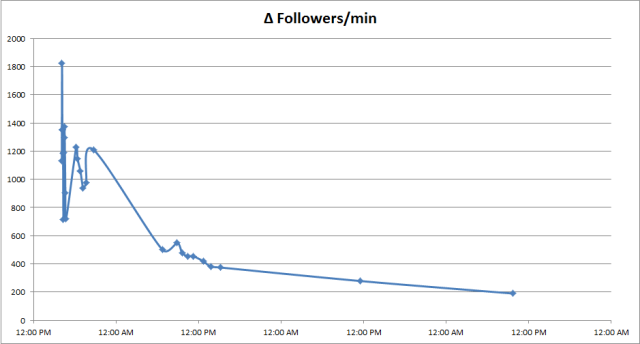
There’s my exponential! We’ll have to fudge the x-values a bit to get an actual equation and trendline.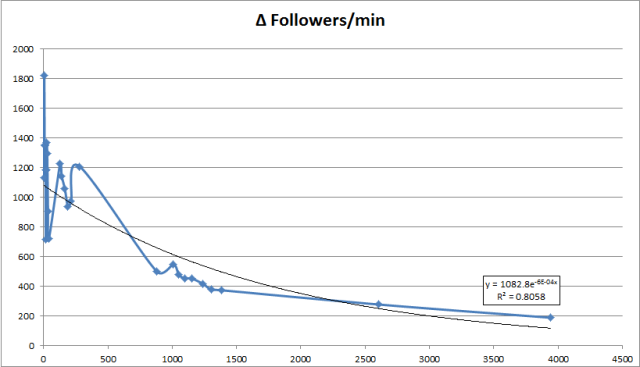
And you know what? I bet if I tossed out a few of those early, “noisy” observation, we’d get a much better fitted curve. But still, it looks like you can pretty well describe the behavior of Charlie Sheen’s number of twitter followers with this exponential decay curve.
Now, what can we do with this? Was this just a ridiculous exercise by someone who spends too much time in front of his computer? Perhaps (probably). But are there any implications for the dramatic growth and tapering off of a (sort of crazy) celebrity’s twitter followers?
Remember in 2010, when LeBron James joined twitter before his announcement of where he was headed, dubbed “The Decision” on ESPN? His twitter followers had a similar explosion at the beginning before he even tweeted anything. I don’t have the data unfortunately. While everyone agrees that “The Decision” was a huge PR mistake, everyone also agrees that the ratings for “The Decision” were through the roof. Let’s put it this way: more people watched “The Decision” where James announced which team he would join than many actual NBA Finals games. Did the simple creation of the twitter account boost the ratings? What if “Two and a Half Men” came back on the air now? I have to assume that the ratings would be similarly boosted. James Franco did something similar before his hosting of the Oscars, joining twitter beforehand.
You think agents and TV and movie execs aren’t aware of the “twitter-effect?” Of course they are, and they’re probably also interested in some of the hard data that comes along with it.
Candela Citations
- Revision and Adaptation. Provided by: Lumen Learning. License: CC BY: Attribution
- Can you predict how many followers @charliesheen has right now? ; Exponential growth? (Part 1). Authored by: Geoff Krall. Provided by: emergent math. Located at: https://emergentmath.com/2011/03/03/can-you-predict-how-many-followers-charliesheen-has-right-now-exponential-growth-part-1/. License: CC BY-NC: Attribution-NonCommercial
- Can you predict how many followers @charliesheen has right now? ; Exponential growth? (Part 2). Authored by: Geoff Krall. Provided by: emergent math. Located at: https://emergentmath.com/2011/03/04/can-you-predict-how-many-followers-charliesheen-has-right-now-exponential-growth-part-2/. License: CC BY-NC: Attribution-NonCommercial
- Learning objectives: Growth Models. Authored by: David Lippman. Located at: http://www.opentextbookstore.com/mathinsociety/. Project: Math in Society. License: CC BY-SA: Attribution-ShareAlike