Learning Outcomes
- Describe the relationship between the definite integral and net area
When we defined the definite integral, we lifted the requirement that [latex]f(x)[/latex] be nonnegative. But how do we interpret “the area under the curve” when [latex]f(x)[/latex] is negative?
Net Signed Area
Let us return to the Riemann sum. Consider, for example, the function [latex]f(x)=2-2x^2[/latex] (shown in Figure 2) on the interval [latex][0,2][/latex]. Use [latex]n=8[/latex] and choose [latex]x_i^*[/latex] as the left endpoint of each interval. Construct a rectangle on each subinterval of height [latex]f(x_i^*)[/latex] and width [latex]\Delta x[/latex]. When [latex]f(x_i^*)[/latex] is positive, the product [latex]f(x_i^*) \Delta x[/latex] represents the area of the rectangle, as before. When [latex]f(x_i^*)[/latex] is negative, however, the product [latex]f(x_i^*) \Delta x[/latex] represents the negative of the area of the rectangle. The Riemann sum then becomes
![A graph of a downward opening parabola over [-1, 2] with vertex at (0,2) and x-intercepts at (-1,0) and (1,0). Eight rectangles are drawn evenly over [0,2] with heights determined by the value of the function at the left endpoints of each.](https://s3-us-west-2.amazonaws.com/courses-images/wp-content/uploads/sites/2332/2018/01/11204006/CNX_Calc_Figure_05_02_003.jpg)
Figure 2. For a function that is partly negative, the Riemann sum is the area of the rectangles above the [latex]x[/latex]-axis minus the area of the rectangles below the [latex]x[/latex]-axis.
Taking the limit as [latex]n\to \infty[/latex], the Riemann sum approaches the area between the curve above the [latex]x[/latex]-axis and the [latex]x[/latex]-axis, minus the area between the curve below the [latex]x[/latex]-axis and the [latex]x[/latex]-axis, as shown in Figure 3. Then,
The quantity [latex]A_1-A_2[/latex] is called the net signed area.
![A graph of a downward opening parabola over [-2, 2] with vertex at (0,2) and x-intercepts at (-1,0) and (1,0). The area in quadrant one under the curve is shaded blue and labeled A1. The area in quadrant four above the curve and to the left of x=2 is shaded blue and labeled A2.](https://s3-us-west-2.amazonaws.com/courses-images/wp-content/uploads/sites/2332/2018/01/11204010/CNX_Calc_Figure_05_02_002.jpg)
Figure 3. In the limit, the definite integral equals area [latex]A_1[/latex] minus area [latex]A_2[/latex], or the net signed area.
Notice that net signed area can be positive, negative, or zero. If the area above the [latex]x[/latex]-axis is larger, the net signed area is positive. If the area below the [latex]x[/latex]-axis is larger, the net signed area is negative. If the areas above and below the [latex]x[/latex]-axis are equal, the net signed area is zero.
Example: Finding the Net Signed Area
Find the net signed area between the curve of the function [latex]f(x)=2x[/latex] and the [latex]x[/latex]-axis over the interval [latex][-3,3][/latex].
![A graph of an increasing line over [-6, 6] going through the origin and (-3, -6) and (3,6). The area under the line in quadrant one over [0,3] is shaded blue and labeled A1, and the area above the line in quadrant three over [-3,0] is shaded blue and labeled A2.](https://s3-us-west-2.amazonaws.com/courses-images/wp-content/uploads/sites/2332/2018/01/11204013/CNX_Calc_Figure_05_02_005.jpg)
Watch the following video to see the worked solution to Example: Finding the Net Signed Area.
Try It
Find the net signed area of [latex]f(x)=x-2[/latex] over the interval [latex][0,6][/latex], illustrated in the following image.
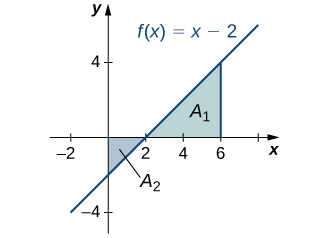
Figure 5.
Total Area
One application of the definite integral is finding displacement when given a velocity function. If [latex]v(t)[/latex] represents the velocity of an object as a function of time, then the area under the curve tells us how far the object is from its original position. This is a very important application of the definite integral, and we examine it in more detail later in the chapter. For now, we’re just going to look at some basics to get a feel for how this works by studying constant velocities.
When velocity is a constant, the area under the curve is just velocity times time. This idea is already very familiar. If a car travels away from its starting position in a straight line at a speed of 70 mph for 2 hours, then it is 140 mi away from its original position (Figure 6). Using integral notation, we have
![A graph in quadrant 1 with the x-axis labeled as t (hours) and y-axis labeled as v (mi/hr). The area under the line v(t) = 75 is shaded blue over [0,2].](https://s3-us-west-2.amazonaws.com/courses-images/wp-content/uploads/sites/2332/2018/01/11204020/CNX_Calc_Figure_05_02_015.jpg)
Figure 6. The area under the curve [latex]v(t)=75[/latex] tells us how far the car is from its starting point at a given time.
In the context of displacement, net signed area allows us to take direction into account. If a car travels straight north at a speed of 60 mph for 2 hours, it is 120 mi north of its starting position. If the car then turns around and travels south at a speed of 40 mph for 3 hours, it will be back at it starting position (Figure 7). Again, using integral notation, we have
In this case the displacement is zero.
![A graph in quadrants one and four with the x-axis labeled as t (hours) and the y-axis labeled as v (mi/hr). The first part of the graph is the line v(t) = 60 over [0,2], and the area under the line in quadrant one is shaded. The second part of the graph is the line v(t) = -40 over [2,5], and the area above the line in quadrant four is shaded.](https://s3-us-west-2.amazonaws.com/courses-images/wp-content/uploads/sites/2332/2018/01/11204023/CNX_Calc_Figure_05_02_016.jpg)
Figure 7. The area above the axis and the area below the axis are equal, so the net signed area is zero.
Suppose we want to know how far the car travels overall, regardless of direction. In this case, we want to know the area between the curve and the [latex]x[/latex]-axis, regardless of whether that area is above or below the axis. This is called the total area.
Graphically, it is easiest to think of calculating total area by adding the areas above the axis and the areas below the axis (rather than subtracting the areas below the axis, as we did with net signed area). To accomplish this mathematically, we use the absolute value function. Thus, the total distance traveled by the car is
Bringing these ideas together formally, we state the following definitions.
Definition
Let [latex]f(x)[/latex] be an integrable function defined on an interval [latex][a,b][/latex]. Let [latex]A_1[/latex] represent the area between [latex]f(x)[/latex] and the [latex]x[/latex]-axis that lies above the axis and let [latex]A_2[/latex] represent the area between [latex]f(x)[/latex] and the [latex]x[/latex]-axis that lies below the axis. Then, the net signed area between [latex]f(x)[/latex] and the [latex]x[/latex]-axis is given by
The total area between [latex]f(x)[/latex] and the [latex]x[/latex]-axis is given by
Example: Finding the Total Area
Find the total area between [latex]f(x)=x-2[/latex] and the [latex]x[/latex]-axis over the interval [latex][0,6][/latex].

Watch the following video to see the worked solution to Example: Finding the Total Area.
Try It
Find the total area between the function [latex]f(x)=2x[/latex] and the [latex]x[/latex]-axis over the interval [latex][-3,3][/latex].
Candela Citations
- 5.2 The Definite Integral. Authored by: Ryan Melton. License: CC BY: Attribution
- Calculus Volume 2. Authored by: Gilbert Strang, Edwin (Jed) Herman. Provided by: OpenStax. Located at: https://openstax.org/books/calculus-volume-2/pages/1-introduction. License: CC BY-NC-SA: Attribution-NonCommercial-ShareAlike. License Terms: Access for free at https://openstax.org/books/calculus-volume-2/pages/1-introduction