Who Are the Elderly?

Based on 2010 statistics from the U.S. Census Bureay, more than half of the older American population are 65–74 years of age, and about 57 percent are female, reflecting males’ shorter life spans. About 80 percent of the elderly are non-Latino whites, compared to about 66 percent in the population as a whole; 8.6 percent are African American, compared to about 13 percent of the population; and 7.0 percent are Latino, compared to 15 percent of the population. Also “in 2018, there were 52 million people age 65 and older, according to the Census Bureau’s Vintage Population Estimates. Their share of the population grew as well, from 12.4 percent in 2000 to 16.0 percent in 2018.”[1]
Table: Demographic Composition of the Elderly, 2010
| Age | |
| 65–74 years | 52.3% |
| 75–84 years | 33.4% |
| 85 years and over | 14.3% |
| Gender | |
| Female | 56.9% |
| Male | 43.1% |
| Race and/or ethnicity* | |
| White, non-Latino | 80.1% |
| African American | 8.6% |
| Latino | 7.0% |
| Asian/Pacific Islander | 3.5% |
| Amer. Ind., Esk., Aleut. | 0.6% |
| Two or more races | 0.7% |
| Living in poverty | 9.0% |
| Marital status | |
| Married | 57.6% |
| Widowed | 28.1% |
| Divorced | 10.0% |
| Never married | 4.3% |
| Years of school completed | |
| 0–8 years | 10.2% |
| 1–3 years of high school | 10.3% |
| High school graduate | 36.4% |
| 1–3 years of college | 20.6% |
| College graduate | 22.5% |
| Labor force participation | |
| Employed | 16.2% |
| Unemployed | 1.2% |
| Not in labor force | 82.6% |
| Household income* | |
| Under $15,000 | 18.8% |
| $15,000–$24,999 | 20.7% |
| $25,000–$34,999 | 15.4% |
| $35,000–49,999 | 15.1% |
| $50,000–$74,999 | 14.2% |
| $75,000–$99,999 | 6.5% |
| $100,000 and over | 9.4% |
| * 2009 data | |
|---|---|
Source: Data from US Census Bureau. (2012). Statistical abstract of the United States: 2012. Washington, DC: US Government Printing Office.
The lower proportions of African Americans and Latinos among the elderly partly reflect these groups’ lower lifespans.
The percentage of elders living in poverty is 9.0, compared to 15.1 percent of the entire population. Although most elders have fixed incomes, the fact that their family size is usually one or two means that they are less likely than younger people to live in poverty. In fact, today’s elderly are financially much better off than their grandparents were, thanks to Social Security, Medicare (the federal health insurance program for older Americans), pensions, and their own assets. We will revisit the health and financial security of elders a little later.

In terms of education, about 22 percent of the elderly are college graduates, compared to about 29 percent of the population as a whole. This difference reflects the fact that few people went to college when today’s elderly were in their late teens and early twenties. However, it is still true that today’s elders are better educated than any previous generation of elders. Future generations of the elderly will be even better educated than those now.
While most elders are retired and no longer in the labor force, about 16 percent do continue to work (see Table: Demographic Composition of the Elderly, 2010). These seniors tend to be in good health and to find their jobs psychologically satisfying. Compared to younger workers, they miss fewer days of work for health or other reasons and are less likely to quit their jobs for other opportunities (Sears, 2009).
Although many older Americans do not fit the negative image with which they are portrayed, it is still true that they face special problems because of their age and life circumstances and because of ageism. Some of these problems are discussed below.
Physical and Mental Health
 Perhaps the problem that comes most readily to mind is health. It is true that many older people remain in good health and are fully able to function mentally and physically (Rowe et al., 2010). Still, the biological and psychological effects of aging do lead to greater physical and mental health problems among the elderly than in younger age groups, as we briefly discussed earlier. These problems are reflected in responses to the General Social Survey (GSS) question, “Would you say your own health, in general, is excellent, good, fair, or poor?” Figure 1 below, “Age and Self-Reported Health” shows that the elderly are more likely than the non-elderly to report that their health is only fair or poor.
Figure 1: Age and Self-Reported Health
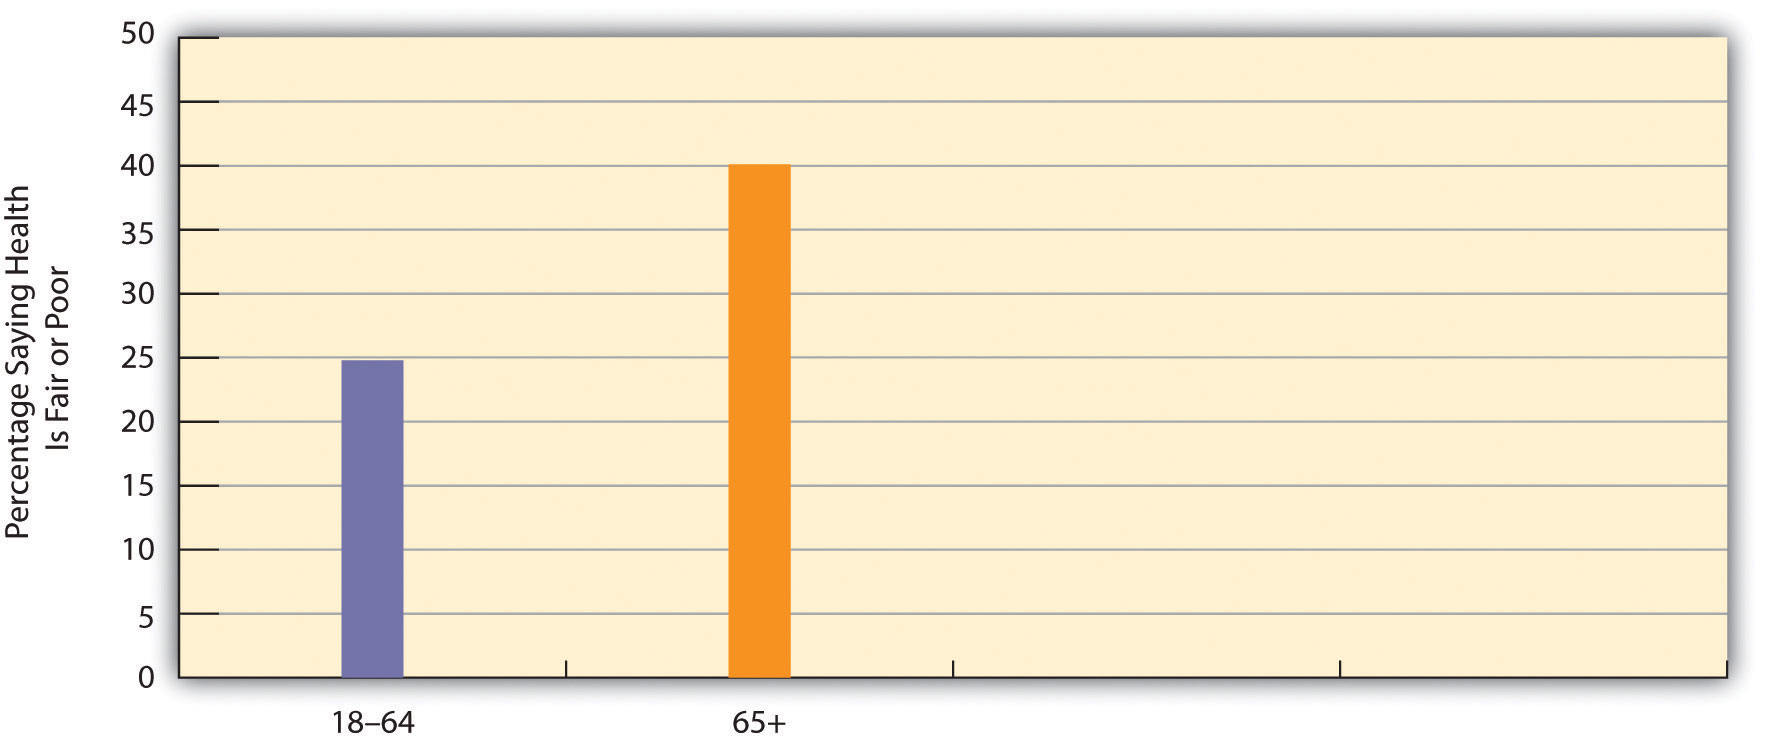
Source: Data from General Social Survey. (2010). Retrieved from http://sda.berkeley.edu/cgi-bin/hsda?harcsda+gss10
The elderly’s perception of their own health is supported by government estimates of chronic health conditions for older Americans. Of all people aged 65 or older not living in a nursing home or other institution, almost 50 percent have arthritis, 56 percent have high blood pressure, 32 percent have heart disease, 35 percent have hearing loss, 18 percent have vision problems, and 19 percent have diabetes (these numbers add up to more than 100 percent as people may have several health conditions) (Federal Interagency Forum on Aging-Related Statistics, 2010). These rates are much higher than those for younger age groups.
The elderly also suffer from dementia, including Alzheimer’s disease, which affects almost 13 percent of people 65 or older (Alzheimer’s Association, 2009). Another mental health problem is depression, which affects almost 15 percent of people 65 or older. Because of mental or physical disability, about two-thirds of all people 65 or older need help with at least one “daily living” activity, such as preparing a meal (Federal Interagency Forum on Aging-Related Statistics, 2010).
Older people visit the doctor and hospital more often than younger people. Partly for this reason, adequate health care for the elderly is of major importance.

If the elderly have more health problems, then adequate care for them is of major importance. They visit the doctor and hospital more often than their middle-aged counterparts. Medicare covers about one-half of their health-care costs; this is a substantial amount of coverage but still forces many seniors to pay thousands of dollars annually themselves. Some physicians and other health-care providers do not accept Medicare, meaning that the patient must pay an even higher amount. Moreover, Medicare pays little or nothing for long-term care in nursing homes and other institutions and for mental health services. All these factors mean that older Americans can still face high medical expenses or at least pay high premiums for private health insurance.
In addition, Medicare costs have risen rapidly along with other health-care costs. Medicare expenditures soared from about $37 billion in 1980 to more than $500 billion today (see Figure 6.2 “Medicare Expenditures, 1980–2010”). As the population continues to age and as health-care costs continue to rise, Medicare expenses will continue to rise as well, making it increasingly difficult to find the money to finance Medicare.
Figure 2: Medicare Expenditures, 1980–2010
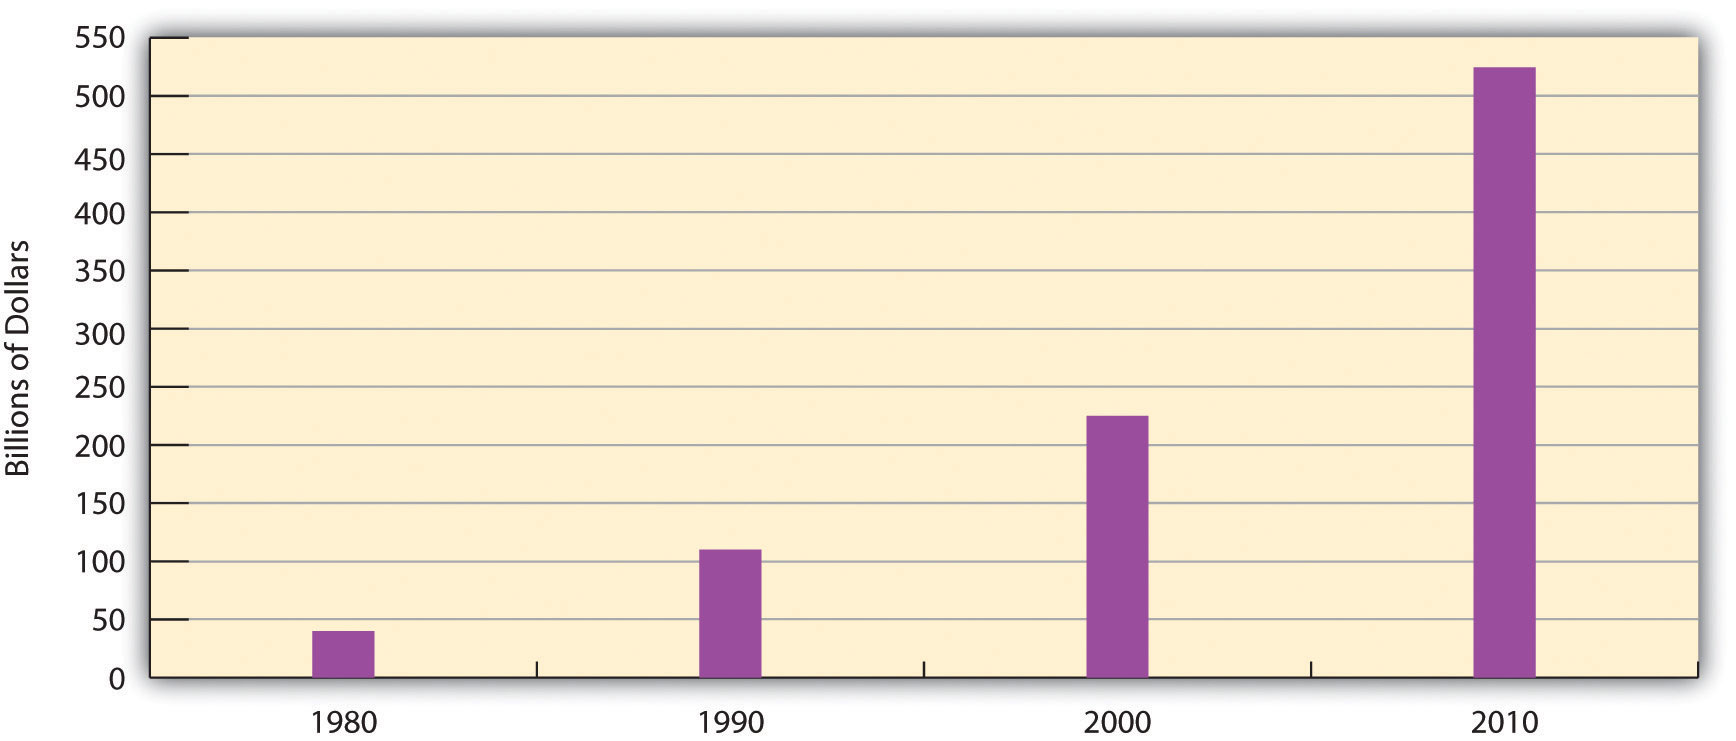
Source: Data from Centers for Medicare and Medicaid Services. (n.d.). National health expenditure data. Retrieved from http://www.hhs.gov
Nursing Home Care
While most older Americans live by themselves or with their families, a small minority live in group settings. A growing type of group setting is the continuous care retirement community, a setting of private rooms, apartments, and/or condominiums that offers medical and practical care to those who need it. In some such communities, residents eat their meals together, while in others they cook for themselves. Usually these communities offer above-average recreational facilities and can be very expensive, as some require a lifetime contract or at least monthly fees that can run into the thousands of dollars.

For elders who need high-level medical care or practical support, nursing homes are the primary option. About 16,100 nursing homes exist, and 3.9 percent of Americans 65 or older live in them (Federal Interagency Forum on Aging-Related Statistics, 2010). About three-fourths of all nursing home residents are women. Almost all residents receive assistance in bathing and showering, 80 percent receive help in using the bathroom, and one-third receive help in eating.
As noted earlier, Medicare does not pay for long-term institutional care for most older Americans. Because nursing home care costs at least $70,000 yearly, residents can quickly use up all their assets and then, ironically, become eligible for payments from Medicaid, the federal insurance program for people with low incomes.
If one problem of nursing homes is their expense, another problem is the quality of care they provide. Because their residents are typically in poor physical and/or mental health, their care must be the best possible, as they can do little to help themselves if their care is substandard. As more people enter nursing homes in the years ahead, the quality of nursing home care will become even more important. Yet there is much evidence that nursing home care is often substandard (DeHart, Webb, & Cornman, 2009). Nursing homes are often understaffed to save costs and are also generally not subject to outside inspection. These conditions help contribute to any substandard treatment of nursing home residents.
Financial Security and Employment

Earlier we noted that the elderly are less likely than younger age groups to live in poverty and that their financial status is much better than that of previous generations of older people. One reason for this is Social Security: If Social Security did not exist, the poverty rate of the elderly would be 45 percent, or five times higher than the actual rate (Kerby, 2012). Without Social Security, then, nearly half of all people 65 or older would be living in official poverty, and this rate would be even much higher for older women and older persons of color. However, this brief summary of their economic well-being obscures some underlying problems (Carr, 2010; Crawthorne, 2008). Once they become poor, older people are more likely than younger ones to stay poor, as younger people have more job and other opportunities to move out of poverty. And the official poverty rate obscures the fact that many people live just above it and are “near poor.” This is especially true of the elderly who, if hit by large medical bills or other expenses, often cannot afford to pay them.
Second, the extent of older Americans’ poverty varies by socio-demographic factors and is much worse for some groups than for others (Carr, 2010). Older women, for example, are more likely than older men to live in poverty for at least two reasons. Because women earn less than men and are more likely to take time off from work during their careers, they have lower monthly Social Security benefits than men and smaller pensions from their employers. As well, women outlive men and thus use up their savings. Racial and ethnic disparities also exist among the elderly, reflecting poverty disparities in the entire population, as older people of color are much more likely than older whites to live in poverty (Carr, 2010). Among women 65 and older, 9 percent of whites live in poverty, compared to 27 percent of African Americans, 12 percent of Asians, and 21 percent of Hispanics.
Third, monthly Social Security benefits are tied to people’s earnings before retirement; the higher the earnings, the higher the monthly benefit. Thus a paradox occurs: People who earn low wages will get lower Social Security benefits after they retire, even though they need higher benefits to make up for their lower earnings. In this manner, the income inequality that exists before retirement continues to exist after it.

This paradox reflects a wider problem involving Social Security. However helpful it might be in aiding older Americans, the aid it provides lags far behind comparable programs in other wealthy Western nations (see “Lessons from Other Societies” below). Social Security payments are low enough that almost one-third of the elderly who receive no other income assistance live in official poverty. For all these reasons, Social Security is certainly beneficial for many older Americans, but it remains inadequate compared to what other nations provide.
Lessons from Other Societies
Aging Policy and Programs in the Netherlands and Sweden
A few years ago, AARP assessed quality-of-life issues for older people and the larger society in sixteen wealthy democracies (the nations of North America and Western Europe, along with Australia and Japan). Each nation was rated (on a scale of 1–5, with 5 being the highest score) on seventeen criteria, including life expectancy, health care for the elderly, pension coverage, and age-discrimination laws. Of the sixteen nations, the Netherlands ranked first, with a total score of 64, while Italy ranked last, with a score of 48; the United States was thirteenth, with a score of 50. Despite its immense wealth, then, the United States lagged behind most other democracies. Because a “perfect” score would have been 85 (17 × 5), even the Netherlands fell short of an ideal quality of life as measured by the AARP indicators.
Why did the United States not rank higher? The experience of the Netherlands and Sweden, both of which have longer life expectancies than the United States, points to some possible answers. In the Netherlands, everyone at age 65 receives a full pension that does not depend on how much money they earned while they were working, and everyone thus gets the same amount. This amount is larger than the average American gets, because Social Security does depend on earnings and many people earned fairly low amounts during their working years. As a result, Dutch elderly are much less likely than their American counterparts to be poor. The Dutch elderly (and also the non-elderly) have generous government insurance for medical problems and for nursing home care; this financial help is much higher than older Americans obtain through Medicare.
As one example, the AARP article mentioned an elderly Dutch woman who had cancer surgery and thirty-two chemotherapy treatments, for which she paid nothing. In the United States, the chemotherapy treatments would have cost at least $30,000. Medicare would have covered only 80 percent of this amount, leaving a patient to pay $6,000.
The Netherlands also helps its elderly in other ways. One example is that about one-fourth of that nation’s elderly receive regular government-subsidized home visits by health-care professionals and/or housekeepers; this practice enables the elderly to remain independent and avoid having to enter a nursing home. In another example, the elderly also receive seven days of free riding on the nation’s rail system.
Sweden has a home-care visitation program that is similar to the Netherlands’ program. Many elderly are visited twice a day by a care assistant who helps them bathe and dress in the morning and go to bed at night. The care assistant also regularly cleans their residence and takes them out for exercise. The Swedish government pays about 80 percent of the costs of this assistance and subsidizes the remaining cost for elderly who cannot afford it. Like the Netherlands’ program, Sweden’s program helps the elderly to remain independent and live at home rather than enter a nursing institution.
Compared to the United States, then, other democracies generally provide their elderly less expensive or free health care, greater financial support during their retirement, and home visits by health-care professionals and other assistants. In these and other ways, these other governments encourage “active aging.” Adoption of similar policies in the United States would improve the lives of older Americans and perhaps prolong their life spans.
Sources: Edwards, 2004; Hartlapp & Schmid, 2008; Ney, 2005
Workplace Ageism
 Older Americans also face problems in employment. About 16 percent of seniors remain employed. Other elders may wish to work but are retired or unemployed because several obstacles make it difficult for them to find jobs. First, many workplaces do not permit the part-time working arrangements that many seniors favor. Second, the rise in high-tech jobs means that older workers need to be retrained for many of today’s jobs, and retraining programs may be hard to find or access. Third, although federal law prohibits age discrimination in employment, it exists anyway, as employers do not think older people are “up to” the job, even though the evidence indicates they are good, productive workers (Berger, 2009; Roscigno, 2010). Finally, earnings above a certain level reduce Social Security benefits before full retirement age, leading some older people to avoid working at all or to at least limit their hours. All these obstacles lead seniors to drop out of the labor force or to remain unemployed (Gallo, Brand, Teng, Leo-Summers, & Byers, 2009).
Age discrimination in the workplace merits some further discussion. According to sociologist Vincent J. Roscigno (2010), survey evidence suggests that more than half of older workers have experienced or observed age discrimination in the workplace, and more than 80 percent of older workers have experienced or observed jokes, disrespect, or other prejudicial comments about old age. Roscigno notes that workplace ageism receives little news media attention and has also been neglected by social scientists. This is so despite the related facts that ageism in the workplace is common and that the older people who experience this discrimination suffer financial loss and emotional problems. Roscigno (2010, p. 17) interviewed several victims of age discrimination and later wrote, “Many conveyed fear of defaulting on mortgages or being unable to pay for their children’s college after being pushed out of their jobs. Others expressed anger and insecurity over the loss of affordable health insurance or pension benefits…Just as prevalent and somewhat surprising to me in these discussions were the less-tangible, yet deeper social-psychological and emotional costs that social science research has established for racial discrimination or sexual harassment, for instance, but are only now being considered in relation to older workers.”
One of the people Roscigno interviewed was a maintenance worker who was laid off after more than two decades of working for his employer. This worker was both hurt and angry. “They now don’t want to pay me my pension,” he said. “I was a good worker for them and always did everything they asked. I went out of my way to help train people and make everything run smoothly, so everybody was happy and it was a good place to work. And now this is what I get, like I never really mattered to them. It’s just not right” (Roscigno, 2010, p. 17).
Bereavement and Social Isolation

“We all need someone we can lean on,” as a famous Rolling Stones song goes. Most older Americans do have adequate social support networks, which are important for their well-being. However, a significant minority of elders live alone and do not see friends and relatives as often as they wish. Bereavement takes a toll, as elders who might have been married for many years suddenly find themselves living alone. Here a gender difference again exists.
Because women outlive men and are generally younger than their husbands, they are three times more likely than men (42 percent compared to 13 percent) to be widowed and thus much more likely to live alone (see Table 3: Living Arrangements of Noninstitutionalized Older Americans, 2010).
| Men (%) | Women (%) | |
|---|---|---|
| Living alone | 19 | 41 |
| Living with spouse | 70 | 37 |
| Other arrangement | 11 | 21 |
Source: Data from Administration on Aging. (2011). A profile of older Americans: 2011. Retrieved from http://www.aoa.gov/aoaroot/aging_statistics/Profile/2011/docs/2011profile.pdf.

Many elders have at least one adult child living relatively nearby, and such children are an invaluable resource. At the same time, however, some elders have no children, because either they have outlived their children or they never had any. As baby boomers begin reaching their older years, more of them will have no children because they were more likely than previous generations to not marry and/or to not have children if they did marry. Baby boomers thus face a relative lack of children to help them when they enter their “old-old” years (Leland, 2010).
Bereavement is always a difficult experience, but because so many elders lose a spouse, it is a particular problem in their lives. The grief that usually follows bereavement can last several years and, if it becomes extreme, can involve anxiety, depression, guilt, loneliness, and other problems. Of all these problems, loneliness is perhaps the most common and the most difficult to overcome.
For an interesting comparison of the U.S. with selected other countries’ quality of life for aging populations, read the article “Multidimensional Comparison of Countries’ Adaptation to Societal Aging” in the Proceedings of the National Academy of Sciences journal (PNAS). Note: read for general concepts and look at the variety of charts and graphs that support these concepts. Don’t worry if you don’t have background for some of the statistical information or the Materials & Methods section – you should find the concepts and comparisons interesting.
[1] U.S. Census Bureau, https://www.census.gov/en.html.
Candela Citations
- Chapter 6.5 Problems Facing Older Americans. Provided by: University of Minnesota M Libraries Publishing. Located at: https://open.lib.umn.edu/socialproblems/chapter/6-5-problems-facing-older-americans-2/. Project: Social Problems: Continuity and Change. License: CC BY-NC-SA: Attribution-NonCommercial-ShareAlike
- image of elderly woman. Authored by: andreagen. Provided by: Pixabay. Located at: https://pixabay.com/photos/elderly-woman-aged-gray-hair-228955/. License: CC0: No Rights Reserved
- image of elderly man with walking stick. Authored by: Besno Pile . Provided by: Pixabay. Located at: https://pixabay.com/photos/grandpa-old-man-senior-elderly-2810809/. License: CC0: No Rights Reserved
- image of elderly man in hospital bed with wife sitting in chair beside bed. Authored by: Ted Van Pelt. Provided by: flickr. Located at: https://www.flickr.com/photos/bantam10/7811851336/. License: CC BY: Attribution. License Terms: CC BY 2.0
- group of elderly men playing chess. Authored by: Tatyana Kazakova . Provided by: Pixabay. Located at: https://pixabay.com/photos/game-chess-men-older-men-old-age-467628/. License: CC0: No Rights Reserved
- image of man in wheelchair being wheeled outside by care worker. Authored by: truthseeker08. Provided by: Pixabay. Located at: https://pixabay.com/photos/hospice-care-patient-elderly-old-1821429/. License: CC0: No Rights Reserved
- image of elderly woman sitting and holding coffee mug. Authored by: Benjamin Alexander. Provided by: Pixabay. Located at: https://pixabay.com/photos/old-lady-woman-old-female-elderly-417174/. License: CC0: No Rights Reserved
- image of elderly man with large brimmed hat. Authored by: Free-Photos . Provided by: Pixabay. Located at: https://pixabay.com/photos/man-beard-hat-smiling-male-face-984433/. License: CC0: No Rights Reserved
- image of older men working in a restaurant. Authored by: Jason Goh. Provided by: Pixabay. Located at: https://pixabay.com/photos/man-old-senior-elderly-male-adult-445178/. License: CC0: No Rights Reserved
- image of elderly woman standing alone. Authored by: pisauikan. Provided by: Pixabay. Located at: https://pixabay.com/photos/granny-old-woman-elderly-4587775/. License: CC0: No Rights Reserved
- image of elderly woman with adult daughter. Authored by: katrena . Provided by: Pixabay. Located at: https://pixabay.com/photos/mother-and-daughter-generations-668167/. License: CC0: No Rights Reserved