Learning Outcomes
- Use a model to determine slope
- Create a model of slope
In this section, we will explore the concepts of slope.
Using rubber bands on a geoboard gives a concrete way to model lines on a coordinate grid. By stretching a rubber band between two pegs on a geoboard, we can discover how to find the slope of a line. And when you ride a bicycle, you feel the slope as you pump uphill or coast downhill.
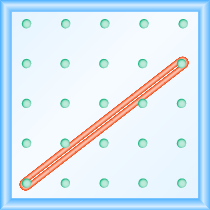
We’ll start by stretching a rubber band between two pegs to make a line as shown in the image below.

Does it look like a line?
Now we stretch one part of the rubber band straight up from the left peg and around a third peg to make the sides of a right triangle as shown in the image below. We carefully make a [latex]90^ \circ[/latex] angle around the third peg, so that one side is vertical and the other is horizontal.
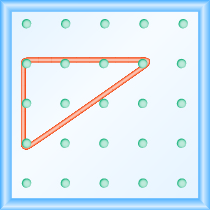
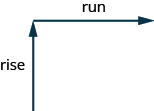
To find the slope of the line, we measure the distance along the vertical and horizontal legs of the triangle. The vertical distance is called the rise and the horizontal distance is called the run, as shown below.
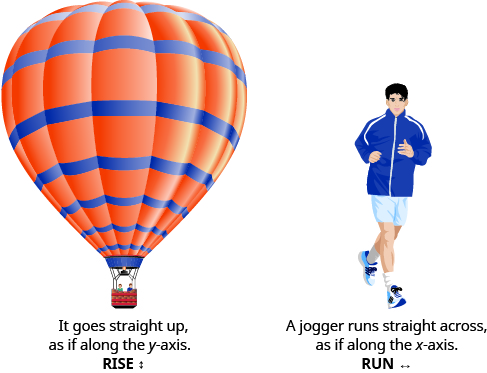
To help remember the terms, it may help to think of the images shown below.
On our geoboard, the rise is [latex]2[/latex] units because the rubber band goes up [latex]2[/latex] spaces on the vertical leg. See the image below.
What is the run? Be sure to count the spaces between the pegs rather than the pegs themselves! The rubber band goes across [latex]3[/latex] spaces on the horizontal leg, so the run is [latex]3[/latex] units.
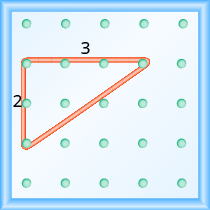
The slope of a line is the ratio of the rise to the run. So the slope of our line is [latex]{\Large\frac{2}{3}}[/latex]. In mathematics, the slope is always represented by the letter [latex]m[/latex].
Slope of a line
The slope of a line is [latex]m={\Large\frac{\text{rise}}{\text{run}}}[/latex].
The rise measures the vertical change and the run measures the horizontal change.
What is the slope of the line on the geoboard in the image above?
[latex]m={\Large\frac{\text{rise}}{\text{run}}}[/latex]
[latex]m={\Large\frac{2}{3}}[/latex]
The line has slope [latex]{\Large\frac{2}{3}}[/latex]
When we work with geoboards, it is a good idea to get in the habit of starting at a peg on the left and connecting to a peg to the right. Then we stretch the rubber band to form a right triangle.
If we start by going up the rise is positive, and if we stretch it down the rise is negative. We will count the run from left to right, just like you read this paragraph, so the run will be positive.
Since the slope formula has rise over run, it may be easier to always count out the rise first and then the run.
example
What is the slope of the line on the geoboard shown?
Solution
Use the definition of slope.
[latex]m={\Large\frac{\text{rise}}{\text{run}}}[/latex]
Start at the left peg and make a right triangle by stretching the rubber band up and to the right to reach the second peg.
Count the rise and the run as shown.
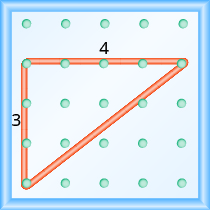
[latex]\begin{array}{cccc}\text{The rise is }3\text{ units}.\hfill & & & m={\Large\frac{3}{\text{run}}}\hfill \\ \text{The run is}4\text{ units}.\hfill & & & m={\Large\frac{3}{4}}\hfill \\ & & & \text{The slope is }{\Large\frac{3}{4}}\hfill \end{array}[/latex]
example
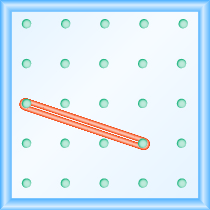
What is the slope of the line on the geoboard shown?

try it
Notice that in the first example, the slope is positive and in the second example the slope is negative. Do you notice any difference in the two lines shown in the images below.
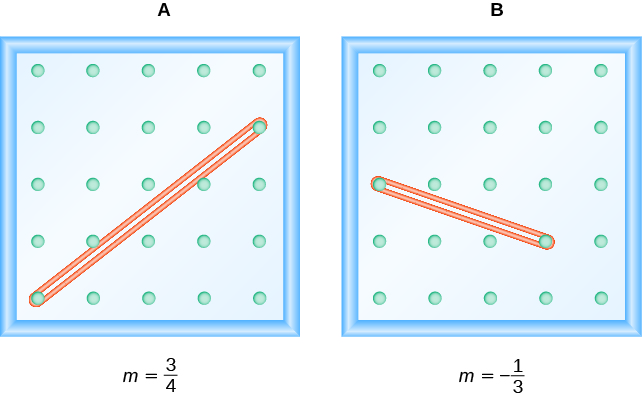
As you read from left to right, the line in Figure A, is going up; it has positive slope. The line Figure B is going down; it has negative slope.

example
Use a geoboard to model a line with slope [latex]{\Large\frac{1}{2}}[/latex].

try it
Use a geoboard to model a line with the given slope: [latex]m=\Large\frac{1}{3}[/latex].

Use a geoboard to model a line with the given slope: [latex]m=\Large\frac{3}{2}[/latex].

example
Use a geoboard to model a line with slope [latex]{\Large\frac{-1}{4}}[/latex]

try it
Use a geoboard to model a line with the given slope: [latex]m={\Large\frac{-3}{2}}[/latex].

Use a geoboard to model a line with the given slope: [latex]m={\Large\frac{-1}{3}}[/latex].

Candela Citations
- Question ID 147013. Authored by: Lumen Learning. License: CC BY: Attribution
- Prealgebra. Provided by: OpenStax. License: CC BY: Attribution. License Terms: Download for free at http://cnx.org/contents/caa57dab-41c7-455e-bd6f-f443cda5519c@9.757